Blog Posts

TWO Dashboards!

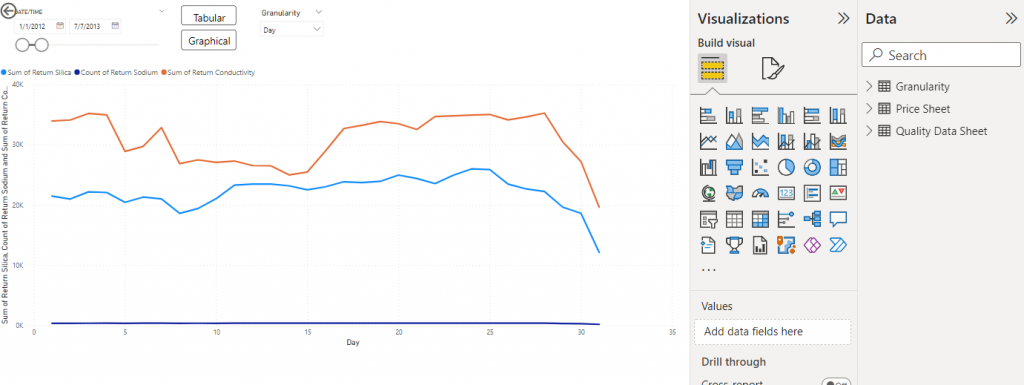
This week we are making leaps and bounds in progress on the dashboards in PowerBI. After getting over a road block with the data not aggregating properly, we were able to complete the rest of the quality dashboard. The best feedback we have received so far is that the supervisor liked the ease of functionality of the granularity parameters. He said that this formatting was much easier than their current way of sorting data. Therefore, we are going to implement the same structure into the cost dashboard.

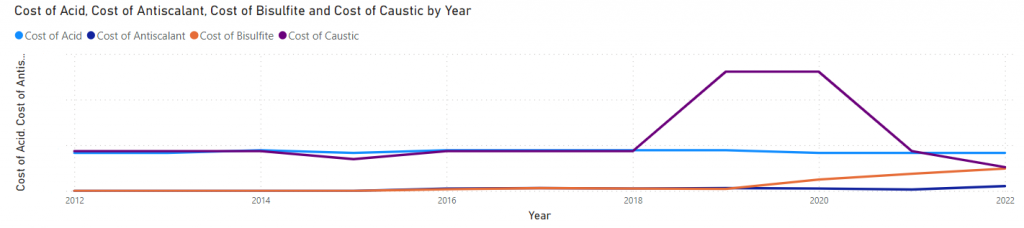
We went to the site on Wednesday to help grant the project sponsor access to the dashboards as well as answer questions he may have. He gave us great feedback that told us we were achieving good progress as well as some actionable items to correct.

Example of chemical cost per year line graph

Tagged as: , , ,

The Sauce is Cooking!

Our team received good feedback after presenting about the progress of our project and our future plans to the Quality Review Board. They advised us to be specific about the milestones we need to be reaching; including answering the questions what, when, and how are we going to achieve this. We implemented this feedback by creating a shared google calendar where we can all add and agree upon dates for reaching our set goals. We have several meetings in place to visit the Duke site and receive feedback on our product from the direct customer. Usability questionnaires will be used to determine the state of the dashboards and identify any places of improvement.

The team is currently working on scrubbing the data within Power BI and building a framework for data interpretation for both the quality and cost dashboards. The Duke data specialist, Marian, has been aiding our progress by answering questions regarding the propagation of data in the dashboard.

Screenshot of the quality dashboard.

Tagged as: , ,

We’ve got the Power BI

Starting out this week we have big news… We all have received access to the Microsoft program Power BI. This is the foundation of our dashboard as it is compatible with Duke’s information platform and will have the capability to input the live data collected at the co-generation plant. We are still figuring out kinks in the collaboration aspect of the application, including establishing a schedule for development.

Example image from Microsoft of their data visualization application Power BI

On Thursday, the team made their way out to the plant to discuss the usability of the dashboard with our direct customers, Steve and Frank. We asked questions like “When you look at the dashboard for thirty seconds, what would you like to see”. Defining the absolutely necessary components versus ones that would be fun as additions is important to ensure that our product solves the problems within our scope first. From here we will be continuing to develop the dashboard and we have set a schedule with Duke for iterative testing.

Getting the Ball Rolling!

In the classroom, we went over the upcoming events that IPPD holds in the spring and the assignments that correlate. This semester we are given the freedom to really dive into our individual projects with allocated class time devoted to project work.

This week our team had our first liaison meeting being back for the spring semester. We discussed next steps including gathering more data and clarifying our boundaries surrounding the development of the cost analysis dashboard. Additional data was requested to fill in the missing informational gaps related to the cost analysis. We anticipate taking a trip to the co-generation plant to get a more complete look at the process through a financial perspective.

Tagged as: , ,

Welcome Back!!

The team took a relaxing holiday break: Kendall enjoyed seeing her older brother, Nicole spent time with friends and family, Julian ate a lot of good food, and Grace relaxed on the beach. We are well-rested and ready to get a jump on our work for the spring semester. Our semester plan is to complete the development of the dashboard in January so that we can spend a lot of time iterating the design with our customers. This is important so that we can fulfill the needs of our customer and the project deliverables.

We wrapped up last semester with a successful system level design review (SLDR), presenting to Ippd faculty and liaisons. Our next step is to continue towards the development of the cost analysis dashboard by running calculations using the important PI data points provided to us by Duke.

Kendall and Grace presenting at the SLDR
Julian and Nicole presenting at the SLDR

Tagged as: , ,

Week 13 – End of the Year!

Team H2Flow has had the best semester in IPPD working with Duke Energy to implement a quality and cost analysis dashboard to their system process. We have learned a lot about the effects of water quality, chemical balances, and corporate relations. Our favorite part would have to be the opportunity to work within such a great team of supportive members, leaders, and mentors.

Looking to next semester, we are exciting to get knees deep in the development of our dashboard in PowerBI and the cost analysis needed to track trends at a granularity of less than a year. We know that we will be able to be successful through the hard work and determination of our team and the support from our liaisons.

We hope everyone enjoys the holiday season with their loved ones and we will see you in the new year!

Week 12 – System Level Design Review

This week the team is going full speed towards the end of the semester, wrapping up work on our project design. We presented our system level design review to three groups on Tuesday: Flyby, Composite Guardian, and Chemboard. It is interesting listening to different groups present their progress for the semester and to hear how they plan to move forward with their projects.

We received a lot of positive feedback at this peer review. We all are developing the skills necessary to confidently present our problem and solution to any kind of audience. Throughout the semester we have presented to peers in the class, IPPD and UF faculty, professors, and company representatives. This has been very valuable practice as seniors preparing to enter industry soon.

We are excited to participate in the System Level Design Review Event this upcoming Tuesday. With all the presentation practice we have done, we are confident we can convey our project successfully to our listening audience. We are looking forward to presenting in-person to our Duke Energy engineering liaison Travis and our executive sponsor Frank.

Week 11 – PID is Here!

On Tuesday, our team presented during the Prototype Inspection Day (PID). We shared our progress and goals for the rest of the semester while receiving feedback from some of UF’s faculty. Our feedback was glowing and by the end of the day we were sure of a few things:

– We have mastered explaining the issue at hand
– We are headed in a great direction
– We should be proud of our progress

Although this feedback was great to hear and very reassuring, the team does have a few things we need to focus our attention on. Some of those being switching to Power BI from Tableau and starting the calculations for the cost analysis portion of our project.

We still have a lot to do, but hearing the feedback has made the team confident in our progress thus far! We are so excited to continue on this path and look forward to sharing more next week.

Tagged as:

Week 10 – Prototype Inspection Day

This week the team is preparing for the Prototype Inspection Day (PID) this upcoming Tuesday. What this entails is:

  • Continuously cleaning data
  • Development of Tableau prototype for quality dashboard
  • Creating PID presentation

We are preparing to present the functionality of our prototype and obtain feedback from a panel of judges. Using Tableau, we were able to quickly put forth a functioning prototype that shows the end user what is to be expected from the final design. The final product will be developed on Power BI for easy collaboration with Duke Energy’s current system for information.

The team is very excited to see our vision come to fruition and the developmental journey that we are on as we look forward to the next semester.

Week 9 -Data Cleaning

After a fun day spent at the co-generation plant last week, we now have our hands on lots and lots of data. This data was pulled from their Pi points, which is connected to sensors that track key performance indicators. Some examples are as follows:

  • Silica and sodium levels
  • Conductivity
  • Flow rates
  • Chemical tanks levels
  • Turbidity

Our next task, scrub the data into something we can use and apply manipulations to. Our team’s industrial engineer, Kendall, is leading the way and helping the rest of the team learn how to go through this process.

Sample collecting area at the co-generation plant

As we prepare for the Prototype Inspection Day (PID), on November 15th, we are currently brainstorming how to validate our design. As we finish up the data scrubbing, we will develop our prototype looking at the quality data first. We will be comparing our dashboard decision making to the manual decisions that are made at the plant to verify the model. Lastly, ensuring that we receive consistent customer feedback is incremental to the success of the project.

Tagged as: , ,