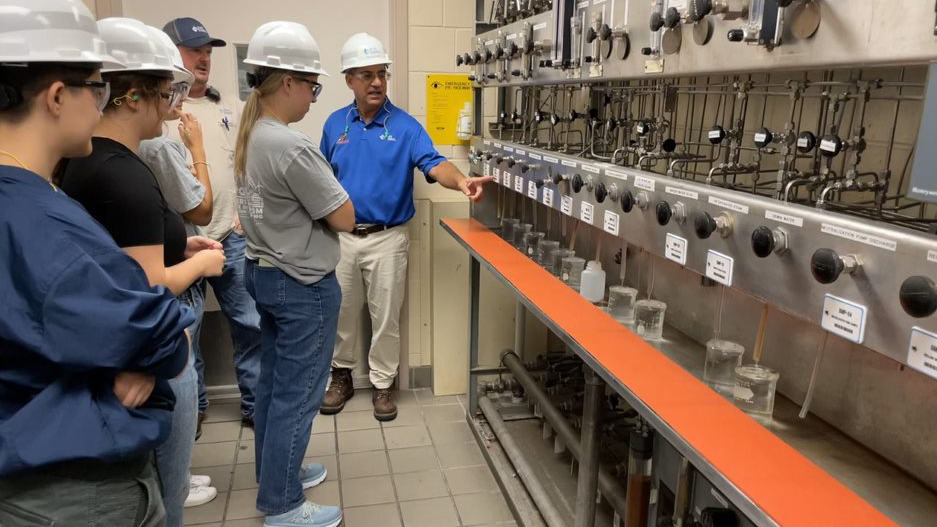
After a fun day spent at the co-generation plant last week, we now have our hands on lots and lots of data. This data was pulled from their Pi points, which is connected to sensors that track key performance indicators. Some examples are as follows:
- Silica and sodium levels
- Conductivity
- Flow rates
- Chemical tanks levels
- Turbidity
Our next task, scrub the data into something we can use and apply manipulations to. Our team’s industrial engineer, Kendall, is leading the way and helping the rest of the team learn how to go through this process.
As we prepare for the Prototype Inspection Day (PID), on November 15th, we are currently brainstorming how to validate our design. As we finish up the data scrubbing, we will develop our prototype looking at the quality data first. We will be comparing our dashboard decision making to the manual decisions that are made at the plant to verify the model. Lastly, ensuring that we receive consistent customer feedback is incremental to the success of the project.