We are diving nose first into the iterative design process for the development of our efficiency dashboard with one main thing in mind: the customer. This week the team went into the co-generation plant, ate a nice breakfast as a team, and started pulling data to feed the dashboard. Our executive sponsors Steve and Frank helped facilitate this meeting with one of Duke Energy’s data experts, Marion.
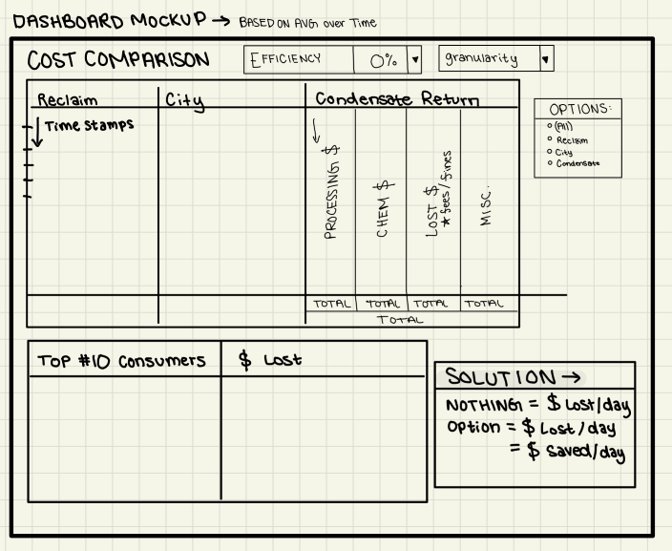
We are excited to say we now have all of our data points that are necessary for the dashboard building. The executive sponsors for the project are our main end user so their opinion on the final product is crucial for the success of design development.