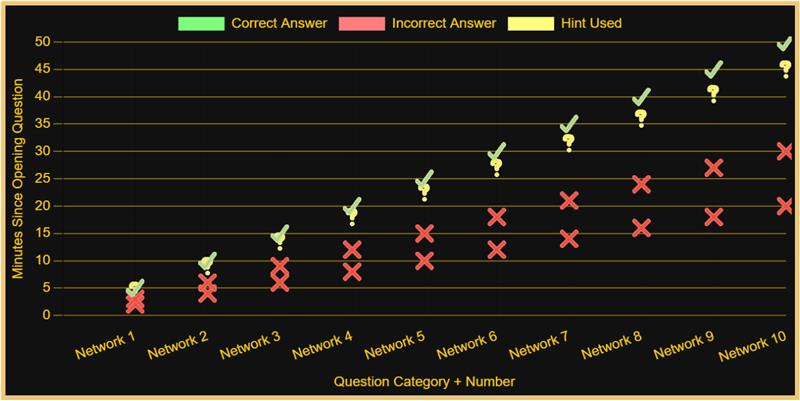
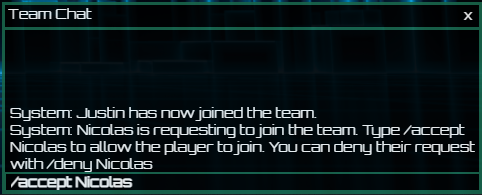
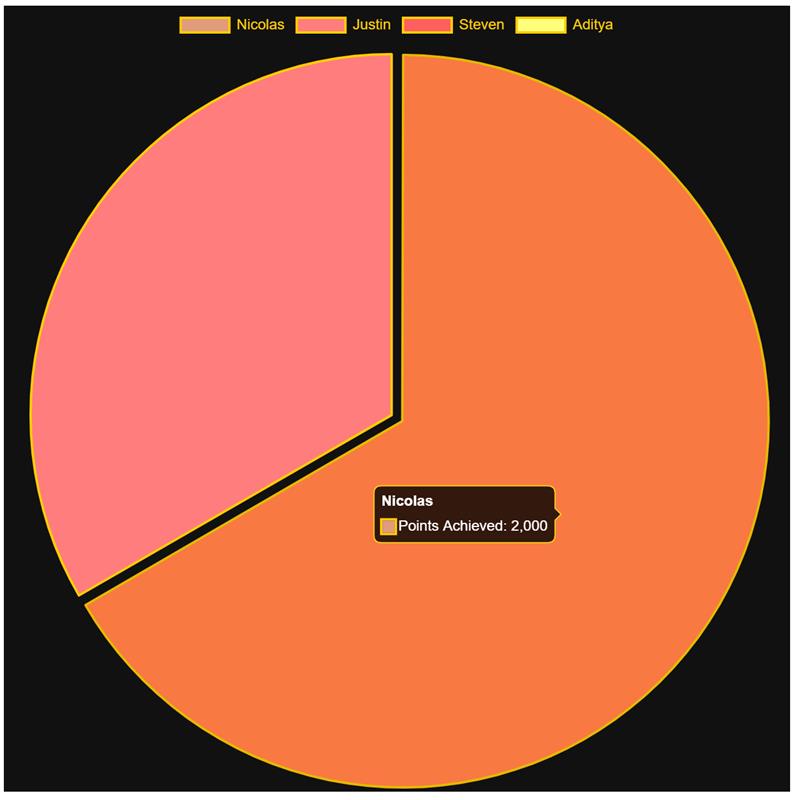
This week we reached the 2nd Prototype Inspection Day and were able to show the work we’ve put into the program the past few weeks. This includes showing the improved team score chart, changing it from the bar graph to the line graph that is easier to see and understand. This also increases the level of competitiveness from the teams by being able to see how the scores change over time. This also includes some additional graphs that are not implemented into the system, but are programmed into the Chart.JS JavaScript library. One of them is a chart that was previously shown on this blog, the individual analysis chart, with some modifications. In addition, we showed some changes that were based on the earlier mock test and the use of the program by our liaison. This included changing the colors on the team chat to allow for easier readability.
With the Prototype Inspection day having passed, we were able to get a lot of feedback on the project and in particular how to prepare our project to show the strengths of what we have done. The presentational feedback will be incredibly useful in our final showcase later this semester. Otherwise we got good feedback and that we are on track to finish this before the end of the class.