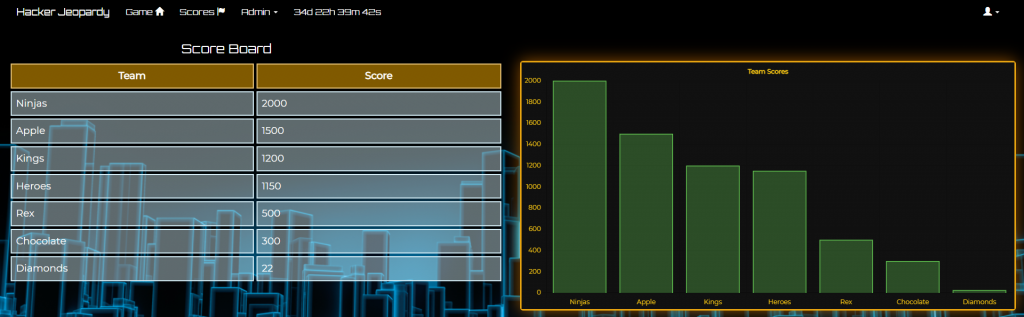
This week we’ve been continuing work on the front-end with Chart.js including working on a bar graph for the teams scores. As a clarification, as planned the final version of the team scores chart will be a line graph showcasing the scores as they change over time. This iteration of the chart is to get work into implementing the chart into the actual program as a whole with the data currently available to us. Additionally, we’ve been working on the presentation for our 2nd QRB and the work associated with it. Including updating our TPMs, and adding more to our paper documentation.