Blog Posts

Week 3 – QRB Presentation And Updates!

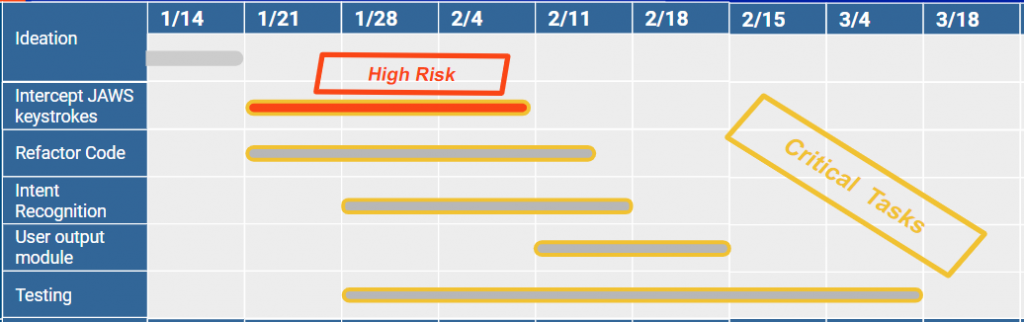
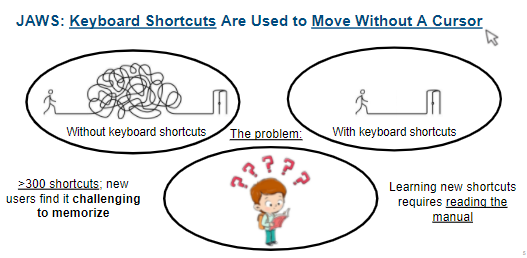
This week we had our Qualification Review Board (QRB) presentation in front of three IPPD coaches! While this presentation the team was able to accurately and throughly describe the technology (JAWS) that we are working with (which was a problem with the SLDR in December), we ended up glossing over the project details. This balance of making sure the audience understands our approach to the problem, while also understanding the problem, has been difficult for us to implement. In the future we are going to add more technical details along with decreasing the technology background a little bit– with this combination hopefully we will achieve the best results. Additionally, we are going to have a 95/5 approach: 95% easy information with 5% hard information. This technique, suggested by one of the judges, will help the audience understand all the easy stuff and maybe even the hard information.

Slide from QRB presentation.

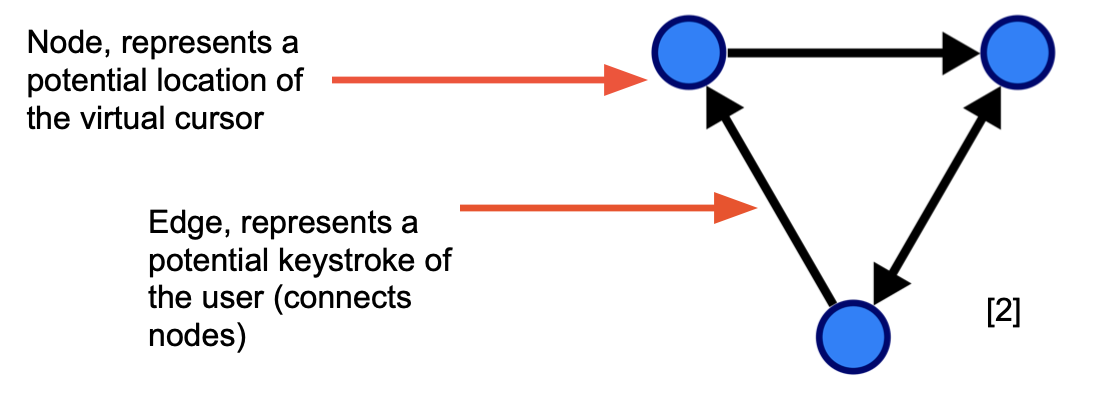
Additional time this week was also spent working on the code with the keyboard interception with JAWS as well as adding more shortcuts to the graphing module. The team was able to achieve a proof of concept that a JAWS intercpetion is possible, so future work will be in implementing this as a new module to the program. This upcoming week we will be working on implementing a notification chime to the user output along with creating simplier language for the user to understand what they did inefficient as well as what they can do efficiently.

Week 2 – QRB 1 Presentation Preparation

Shows how we want our computer (represented by the brain) to recognize a webpage as a graph, with nodes and edges

This week, we prepared for our QRB presentations. Sumanth and Mariana worked on cleaning up the code, as we had a hundred-LOC file containing all of our Javascript, which was difficult to read. Erynne and Ryan worked on the QRB presentation, which we will be presenting next week. We recognize intent recognition as potentially the most difficult aspect of our project, so we have started a search for a professor to speak with. We were able to work with our coach to identify potential blind or visually impaired users to test our project on, however, we were informed that our coach needed one to two weeks of time to schedule it.

Week 1 – Spring Semester Plan!

Team Key-Saurus is back from their winter break and ready to get started implementing new features to our next prototype of the shortcut nudging system. The team wishes to include a bunch of new features into this prototype, which is seen below.

  1. JAWS interception – prototpye 1 runs a psuedo JAWS in the background, since we can’t work with JAWS directly. However, we are trying to see if we can have a JAWS interception instead.
  2. Refactoring the code – prototype 1’s code is not neat, and not the best for when Freedom Scientific takes over and utlilizes the code.
  3. Intent recognition – prototype 1 uses time to gauge user intent, and this methodology can work sometimes but not always. Thus, we are seeing if we can implement a more complex algorithm to better recognize user intent.
  4. User output module – needs a better interface with simplier language, additionally we will be adding a chime notification as an alert.
  5. Testing – testing of the program through various websites along with visually impaired users.

Below is the projected timeline, with the JAWS interception being the most high risk due to the number of unknowns involved. We plan to follow the timeline as closely as possible to then move on to prototype 3. If we end up needing more time, then prototype 2 will be the final design.

Prototype 2 Timeline

Week #15 – System Level Design Review Day!

This week we presented our System Level Design Review to the IPPD community. At the end of the presentation, we thanked Sriram Ramanathan and Idalis Villanueva for their support and guidance of this project. Idalis provided us detailed feedback on improving our presentation After the presentation, we went to Momoyaki with Sriram and Carl Wise of Freedom Scientific. It was valuable to hear about his experiences at Freedom Scientific and helps us to consider careers with them.

As the semester comes to an end, we celebrated by doing a lot of paperwork and working hard for our final presentation. Though there is a long way to go, our presentation demonstrated how much we have grown since we started this posting in this blog. We will be taking a break from the project for the holidays, but for the following semester, we want to dedicate our time to:

  • Debugging our current demo
  • Learning more about machine learning for user intent
  • Understanding how we could implement JAWS itself into our project

It has been a long semester, but we are proud of what we have built and excited to continue improving on it throughout the Spring semester!

From left to right: Mariana, Ryan, Erynne, Sumanth, and the liaison Sriram.

Week #14 – System Level Design Review prep

This week we worked on presenting the system level design review (SLDR) to our classmates as well as our liaison. While our classmates really liked our presentation, the liaison informed us that we needed to go to the next level and become overall better professional presenters. The main problem was our description of how visually impaired users navigate a website, and to this our liaison told us to use an analogy. There is one analogy that is well known at his company for describing this, this analogy is called “A Tale of Two Rooms”. Through explaining how a sighted person can see everything at once, just like in a lit room, versus how visually impaired users must use a torch, their “virtual cursor” to see a room in the dark.

Furthermore, the liaison told us to create a recording of our demo as well as a recording of any examples (inefficient vs efficient computer usage). Using a recording is better than a live demo as it takes out the possibility of it not working correctly. A couple of other small comments were made, but not note-worthy to mention. Therefore, this week is dedicated to making our presentation stronger for when we present in front of the executives next week.


Week #12 – Prototype Inspection Day

This week we presented our prototype to four groups of judges. We received valuable feedback about some difficult components of our project, including that we use dynamic linked library (DLL) hooks to intercept keystroke input at the kernel level from JAWS. We were also suggested to speak with visually impaired individuals by Dr. Latorre. He recognized that someone who had never used JAWS before would struggle with the program, not due to using suboptimal keystrokes, but because they were simply not familiar with the program. The ideal candidate to review our nudging system, he suggested, would be someone with some level of competency in JAWS but also not expertise with the software to the extent that they know all 300+ keystrokes. We realized that this is an important factor to consider as there is little purpose in nudging someone when they have no idea what is going on.

After prototype inspection, we went to the Herbert Wertheim Lab of Engineering Excellence to make progress on our nudging system

As we have completed a major milestone (the prototype inspection #1), we now have more free time to work on the core components of our system, which includes a Python server to generate graphs of our webpage and Dijkstra’s algorithm to find the shortest paths between nodes on a webpage.

Blog Post #11 – Prepping for Prototype Inspection Day!

Next week is prototype inspection day and we are excited to test out our prototype with everyone! We plan to have an interactive design where the judges can experience what it is like to navigate a computer as a visually impaired user. We will follow this up with a quick presentation about how we created our design up until this point as well as what we plan to do for the future. Hopefully we can do an audio recording of the Q&A portion of our presentation so we can fully appreciate everyone’s input and comments. 

This week we accomplished creating a live data input to feed into our code, however we have yet to test this out. Therefore, we also created a fake sample data set as back up. Furthermore, we are creating a module output for a keyboard suggestion. Lastly, on the chrome plugin to collect the live data, that is used in tandem with our demo website, we are creating hotkeys to mimic JAWS. We have to do this because JAWS does not allow us to get any keyboard data when it is in use. As seen in the figure below, we are going to be traversing the DOM through hotkeys that jump from one section to another.  

Representation of a website layout. 

Blog Post #10

This week, we worked on our backlog of things that need to be implemented. We needed to show our liaison, Sriram Ramanathan, that we would have deliverables ready for our Dec 7. Towards this goal, we started on a simple website (bottom figure) that will be easy to map into a graph. The whiteboard below shows some of the items we hope to accomplish this week. We have had issues with Sharepoint. For example, we have been unable to delete files, leading to disorganization. To be more organized, Sumanth is going to make a deleted files folder so that files we would like to have deleted can be moved into this folder so that they can be deleted.

A shared Google Drive folder already exists to keep our documents organized, which helps us to be more productive with coursework. It also helps us to stay up to date with what the current notes are, as Google Docs are easier to edit simultaneously. Using the built-in Teams office software, we would often run into issues where one person’s document was out of date and their updates to the document could not be merged with the changes of the other people.

Blog Post #9 – Sample Data, Shortest Path Implementation– And a Gas Leak!

We had a lot of excitement this week! First, we accomplished creating a graph with nodes from our HTML input and we also started on creating the sample data to test it. This means that our demo is close to being done within the next couple of weeks! Additionally, we are getting started with creating an algorithm that analyzes the shortest path between two nodes on the website for useful formatting when representing the graph. This will hopefully be finished by next week, and we will soon start preliminary testing of our demo with sample data.

Our last excitement for the week was when the construction site next to our classroom had a gas leak! We had to evacuate outside and wait for almost an hour before we were cleared to go back in.

Waiting to go back to our classroom because of the gas leak!
From left to right: Mariana, Ryan, Erynne (and Sumanth is in the background next to the bike).

Blog Post #8 – Presenting to Freedom Scientific

This week, we presented to Freedom Scientific. We focused on the graph part of our solution, which is a very important part of it. As we are representing a webpage as a graph, we are able to find the shortest paths using Dijkstra’s Algorithm, which scales well to larger webpages. We also learned more about the limitations of our solution. It is not a problem if we provide a nudge several hours after a person makes a suboptimal action, as they still get the nudge. This might not be ideal, but it could still be helpful for a user.

In our presentation, we explained what a graph is, as that is an essential part of our work. The blue circles are nodes and the black lines are edges. The edges are potential locations of the virtual cursor and the edges connect them with keystrokes. For example, a user could press the down key, which is represented as a black line, to move between one of the top and bottom nodes. Below is an explanation of how we represent a webpage using a graph.