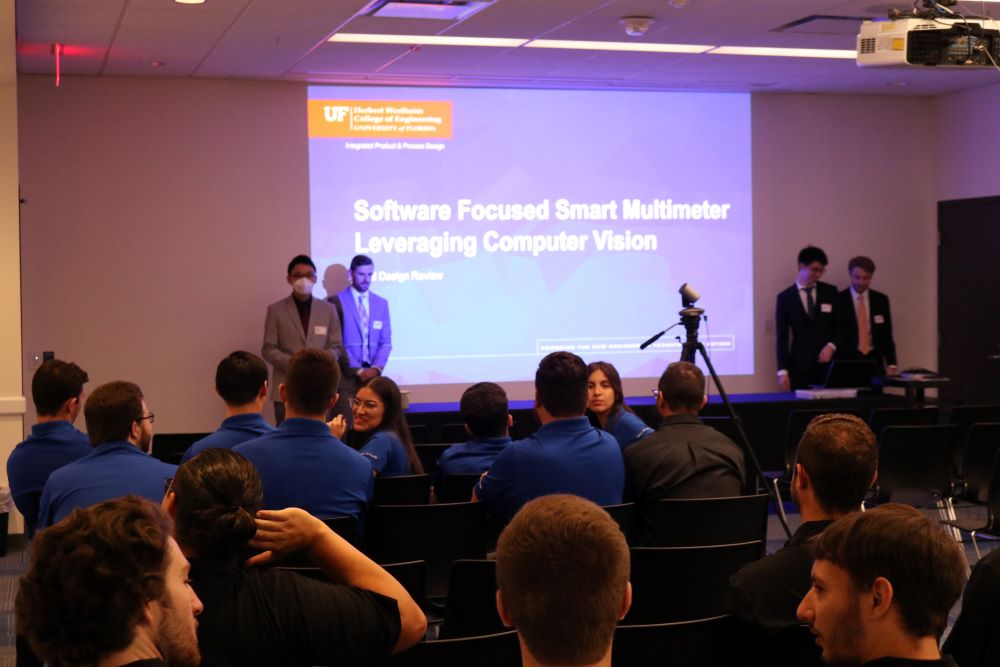
This week is the last week for us! We presented our FDR to our sponsors and received overall positive feedbacks, we then presented our project to the general public in the Reitz Union and received many encouraging comments. Overall, we had a great experience with IPPD, and going forward, we hope that our sponsor CAE. USA will continue to develop this project as there are great potentials in the future.
This is the last week before the Final Design Report presentation! The team spent the week working on the report, as well as polishing the promo video and the poster. The poster has been left largely unchanged, we redid the subtitle for the video and added credits. The team has finished the draft for the FDR and has been working on polishing the report. The team is also working on creating a presentation for the FDR.
This Tuesday, the team was invited to attend a local investor showcase as part of IPPD. We prepared a three minute presentation that showcased our project.
This week, team MultiVision worked on created the draft of the promo video and the poster. For both the poster and the video, the team opted to reduce the amount of technical details and instead focus on appealing to the general audience. We presented the draft video to the class and received mostly positive reviews. Some feedbacks suggested decreasing the font size and speed of the subtitle so it’s easier to read.
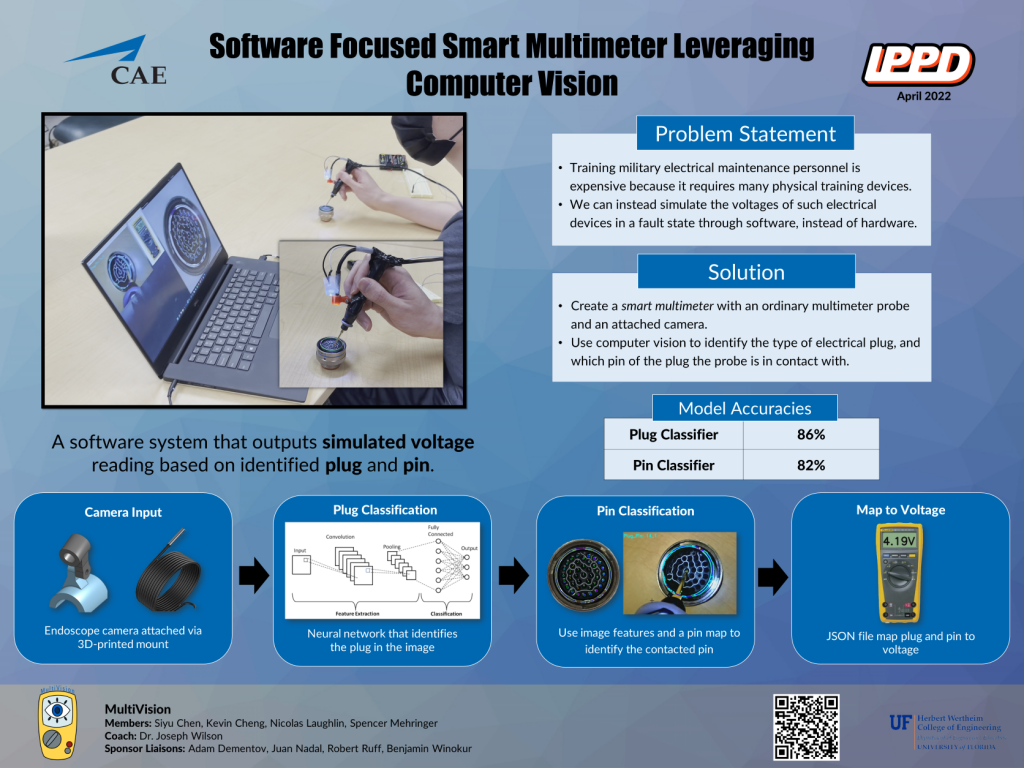
In addition to the presentation deliverables, the team also conducted the last round of live testing. The focus this time was to know the impact result averaging had on the system. Here’s our result: average plug accuracy: 81.51%, average plug accuracy (with result averaging): 85.99%; average pin accuracy: 78.20%, average pin accuracy (with result averaging): 81.56%.
This week, the team worked on preparing for the final design report and presentation at the end of the semester. This included creating a storyboard for the promotion video that the team is going to shoot and setting up the outline for the final design report that the team is going to write. In addition, following the prototype inspection, the team have been selected to present in front a group of investor as a representative of the IPPD program.
Beside preparing for the final deliverable, the team have also made some final adjustments to the system. This includes adding error correction via weighted averaging to the pin classification, and adding error correction to the live testing script so the actual performance impact of error correction can be measured. The team have also created a mock voltage display that maps the outputted plug and pin number to specific voltage numbers. Although this doesn’t make any meaningful improvements to the system, it helps the team in presenting the intended use case of the system.
The team plans on ceasing any big development to the system at this point and instead focus entirely on creating the final deliverables. This include the promotion video, the project poster, the written report, and the presentation.
This week was prototype inspection week. In preparation for the presentation, the team updated the live system: added new visualizations for pin classification, cleaned up the pin maps so they can be used during the presentation as an visual aid, and added a histogram display for plug classification so it is easier to see why a particular plug was chosen.
The team chose 7 plugs out of the 15 plugs in total to present. Of the 7 plugs, plug 15 was a base case to demonstrate the capability of the system, as it was easy to identify with few pins. Plug 1 and 14 were visually similar to each other, so they were chosen to demonstrate the capability of the plug classification system. The remaining 4 plugs were chosen to demonstrate particular edge cases of the pin classification system: plug 16 was a male plug, plug 12 was too large for the camera, plug 8 had a tall shell, and plug 6 allowed the probe to be inserted too deeply into the pin holes.
After the presentation, the team received overall positive feedback regarding their progress. In particular, the feedbacks focused on improving the readability of the visual display, and have a more comprehensive explanation for the purpose of the project as well as the testing plan.
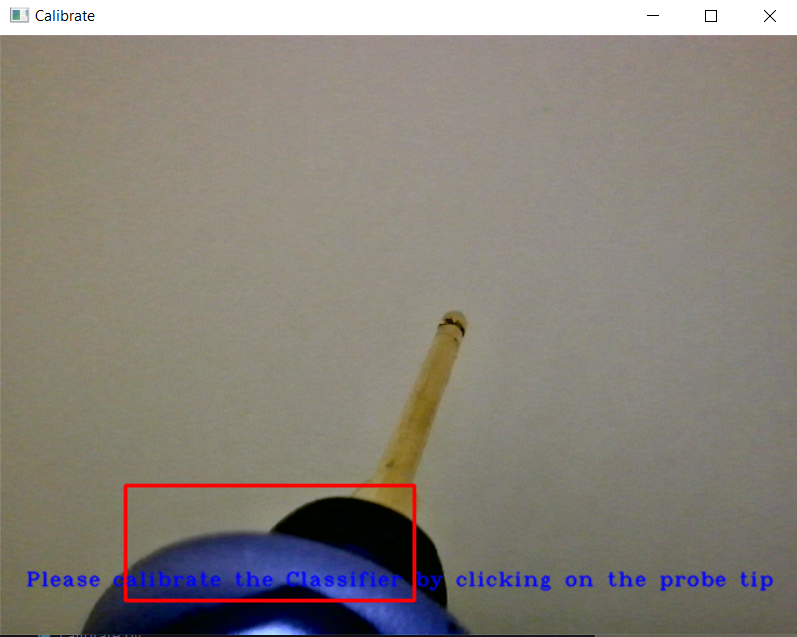
This week is the first week after spring break. The team has completed the live testing processes, looking at the results, we have decided to use the feature extraction approach for pin classification, as the CNN model for pin classification did not produce satisfactory performance. In addition to live testing, the team have also completed the live system, it allows plug and pin classification to be run together and produce results continuously. It also includes a error correction step, which uses weighted averaging to correct the occasional incorrect classifications in the plug and pin classification. An additional calibration step have also been added, which prompts the user to click on the position of the probe tip when initializing the live system, this would improve the accuracy of probe tracking.
Next week is Prototype Inspection week. The team is working on preparing the presentation as well as making adjustments to the live system to provide more information for the audience. Afterwards, the team plans to end major development for the project on March 27th, and shift focus on to cleaning up the system and preparing the report to be presented to CAE.
Newly collected image with different lighting conditions
This week we have begun our live testing process. This process collects a new dataset to be used in optimizing our models. While collecting new data, our latest models are run on each collected frame to immediately gauge our performance. In four days, we have collected new data and conducted preliminary testing on eight plugs. The process of this live testing and data collection is significantly faster than our previous data collection for training since we do not have to collect as many images.
Our current performance is within our expectations. Performance between plugs and pins vary sometimes significantly. The next steps in improving our models will be in thorough investigation of our deep learning models. This consists of analyzing outputs of specific frames to try to gain an understanding of how our black-box model works.
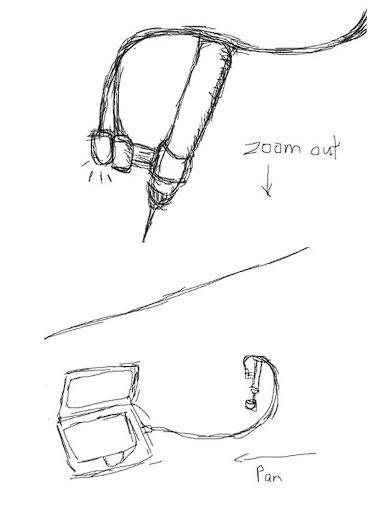
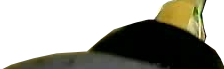
This week we made strides in our feature extraction approach. Determining the location of the multimeter probe tip in a frame has proven to be a challenge. This is due to the camera perspective changing slightly during use. This issue is obvious in our newly collected dataset. Since finalizing the dataset, we have secured the camera mount on the probe to reduce this issue. Nonetheless, we have implemented template-matching in our feature extraction pin classifier to assist in probe tip localization. This works by taking a template of a portion of our probe, as seen above. Using this, the system attempts to match this template to a location in the image. From this location, we can deduce the position of the probe and tip.
As well, we have began our live testing process. A new script was created for this process of collecting a live testing dataset. This set will be used to finally validate our deep learning and feature extraction models.
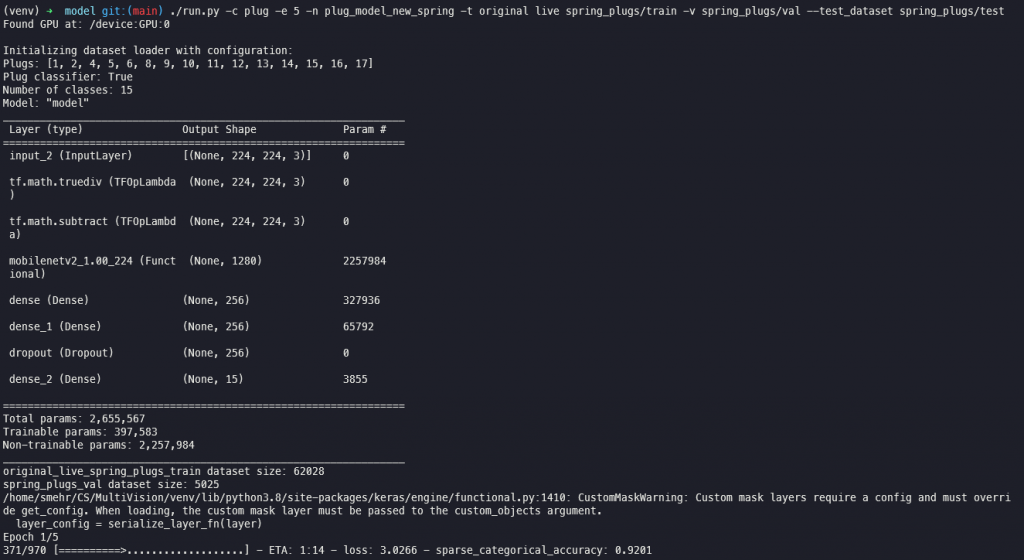
Deep learning model training using command-line arguments for configuration
Improvements have been made with deep learning model training workflow. Given that we have four separate datasets available to us, we now can declare which datasets to use for each of the train, validation, and testing sets for the model. As well, we can concatenate multiple datasets together. This gives us greater flexibility in how we train our models. This is the first stage of our final tuning of our deep learning models for plug classification. Pin classification using a deep neural network has been archived as we have greater faith in our hand-written feature extraction approach. However, the pin classification models we have been creating will still be tested.
Live testing will start next week for plug and pin classification using both deep learning and feature extraction models. This is impactful for the deep learning models as it gives us true insight to model performance. Using this new live testing dataset, we can perform final tuning. We are also excited for our QRB 2 next Tuesday and what suggestions the review board has for us.
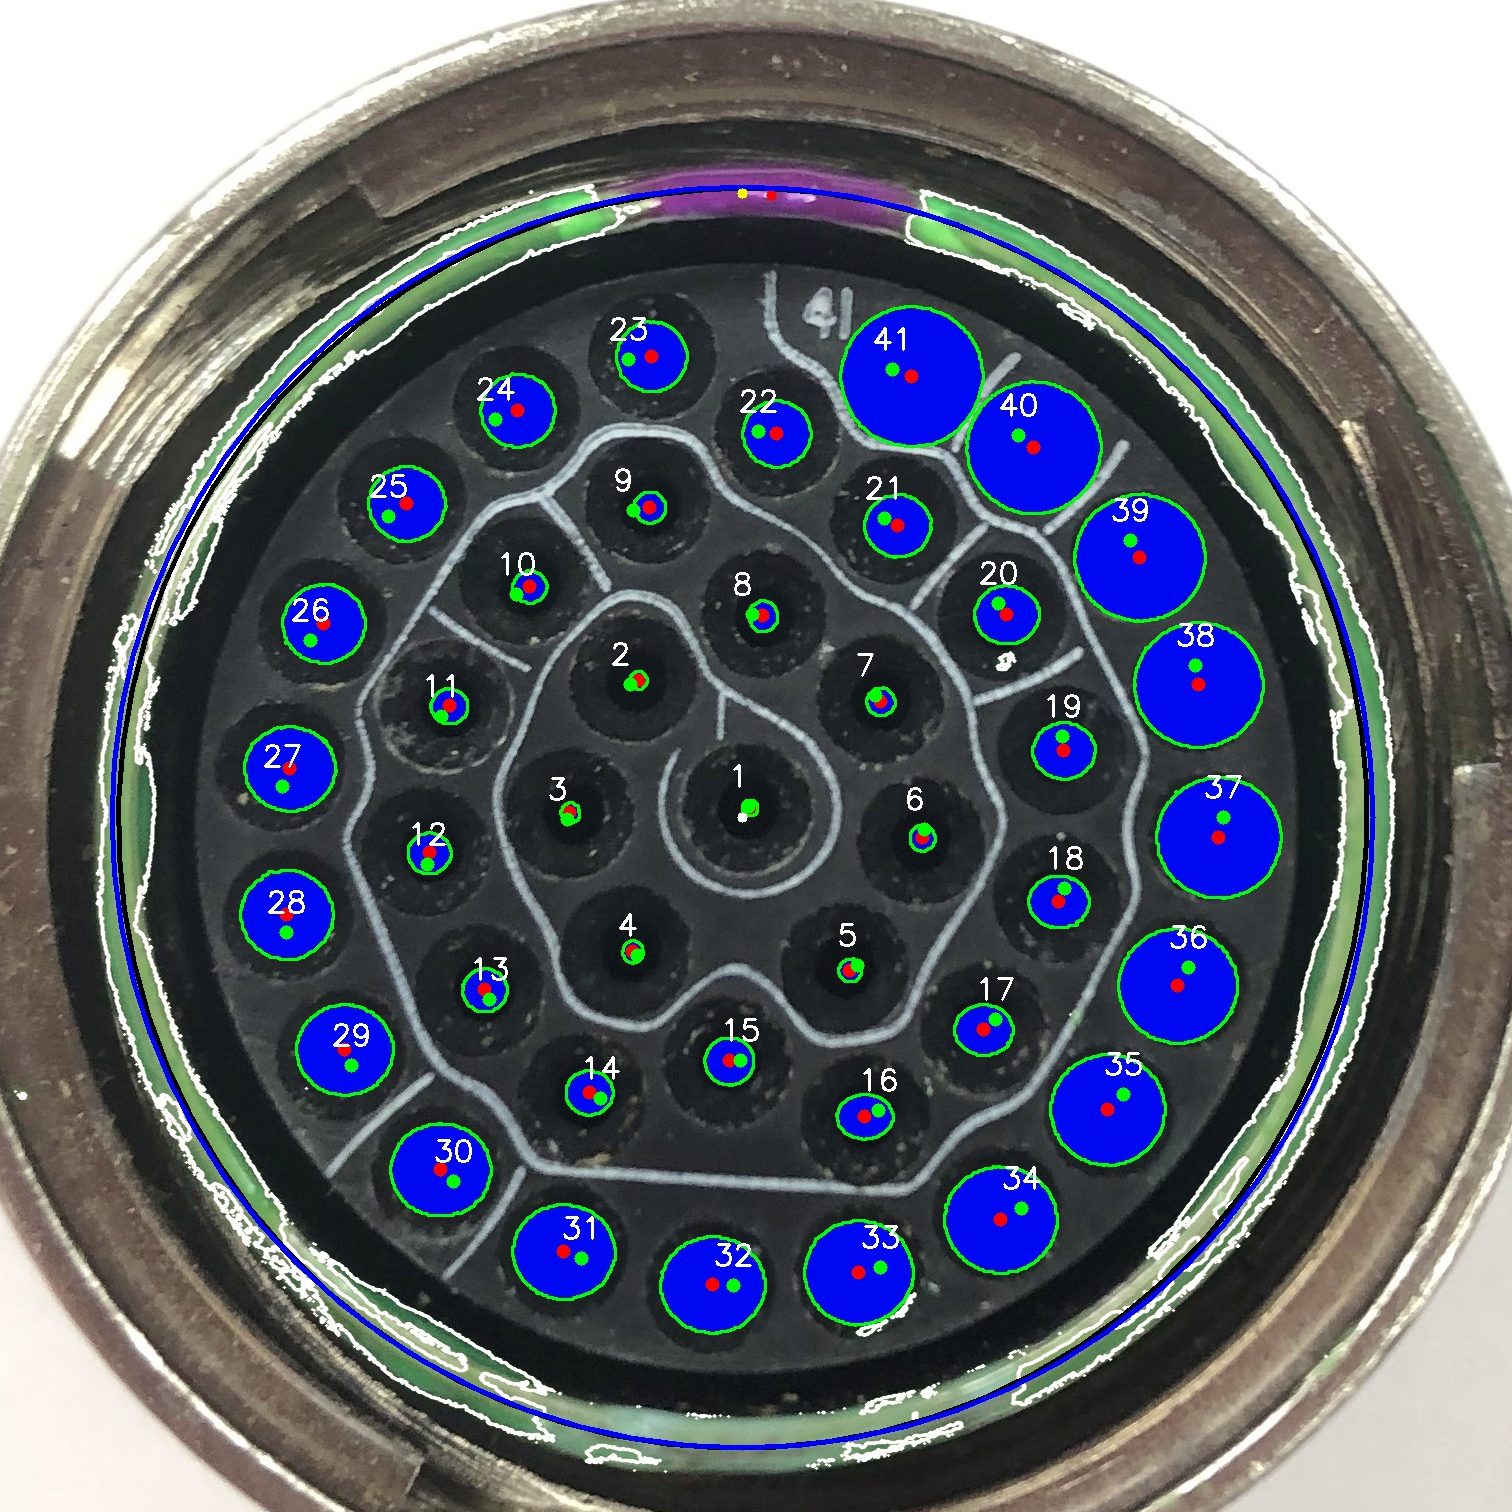
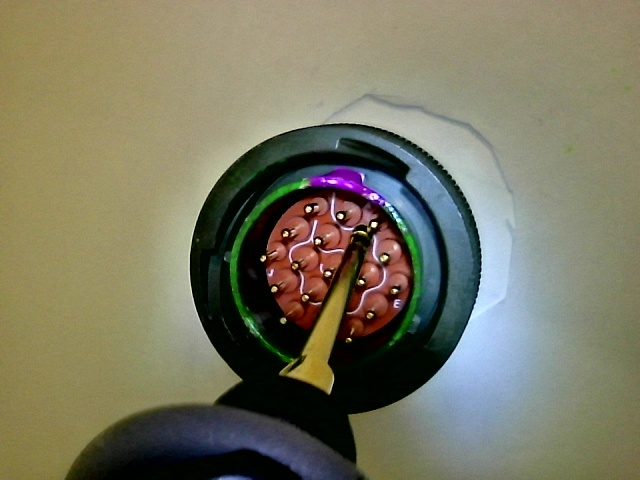
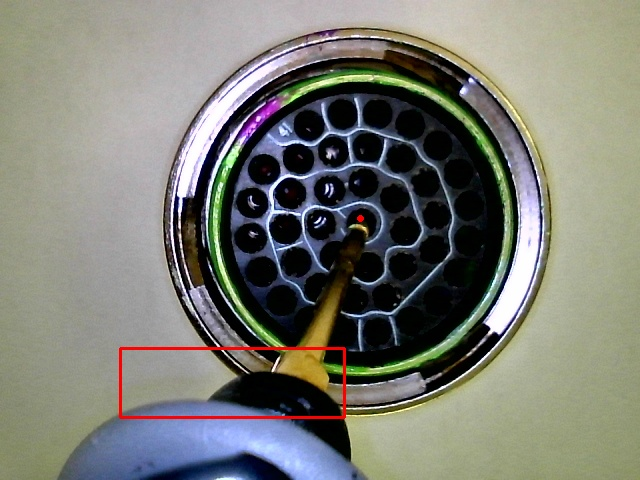
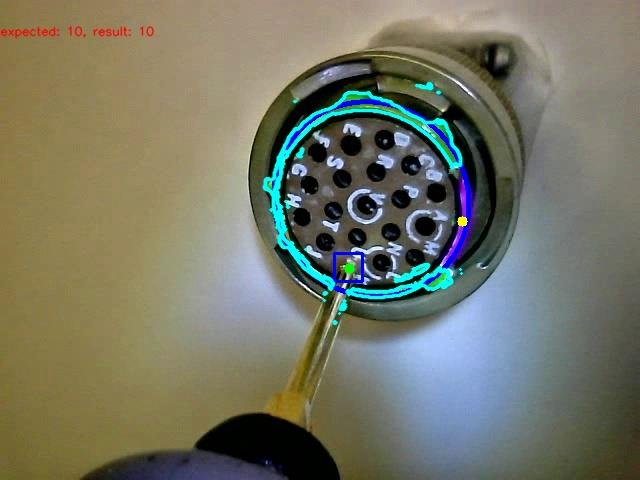
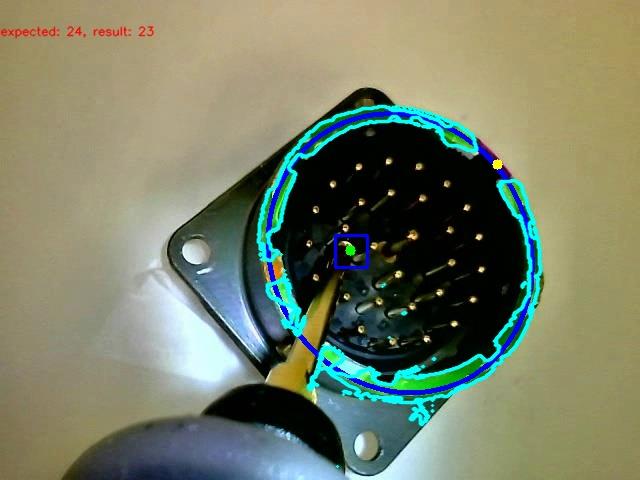
The team has finished up data collection, completing the second set of data to be used in training and testing. With that being completed, some preliminary testing has been done with the feature extraction approach for the pin classification. Before putting together both the feature extraction and pin maps that were created, an additional step was done as well which is probe tracking to allow the system to identify changes in position of the probe overtime. For the images above, the left image was able to correctly identify the position of the probe and relate that to the pin map for a correct prediction. The right had some slight confusion with the position of the probe being close to two different pins which is a problem the team is now currently working on for feature extraction.
With the completion of the dataset, the deep learning approaches for both the pin and plug classification has moved into the stage of fine tuning the models for classification. The team plans to run live test and continually improve different parameters and other optimizations that can be done during the next few weeks.