This week, we presented to Freedom Scientific. We focused on the graph part of our solution, which is a very important part of it. As we are representing a webpage as a graph, we are able to find the shortest paths using Dijkstra’s Algorithm, which scales well to larger webpages. We also learned more about the limitations of our solution. It is not a problem if we provide a nudge several hours after a person makes a suboptimal action, as they still get the nudge. This might not be ideal, but it could still be helpful for a user.
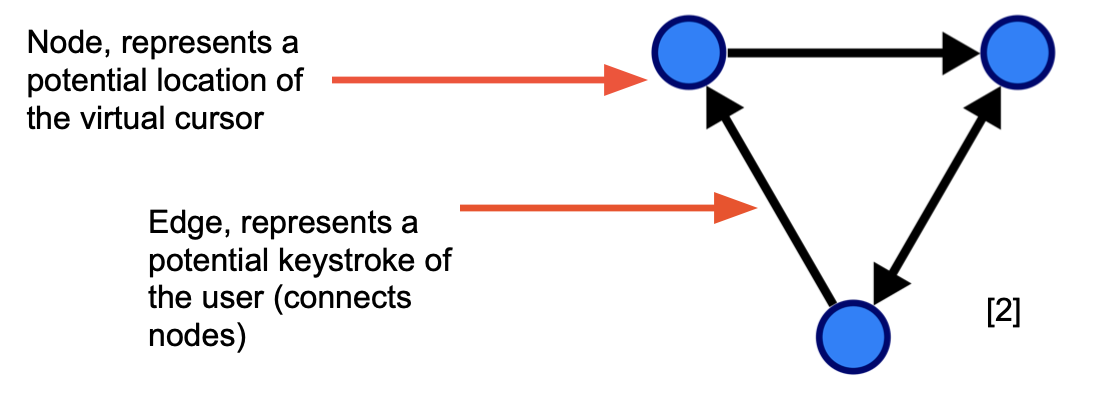
In our presentation, we explained what a graph is, as that is an essential part of our work. The blue circles are nodes and the black lines are edges. The edges are potential locations of the virtual cursor and the edges connect them with keystrokes. For example, a user could press the down key, which is represented as a black line, to move between one of the top and bottom nodes. Below is an explanation of how we represent a webpage using a graph.