During this week of the 11th of November, we’ve been hard at work preparing visuals and in-depth concepts for next Tuesday’s Prototype Inspection Day. Most of this work has gone in to two areas that we will focus on during that day: the student analysis page (which we mentioned in last week’s blog post), and a walkthrough of the Hacker Jeopardy system.
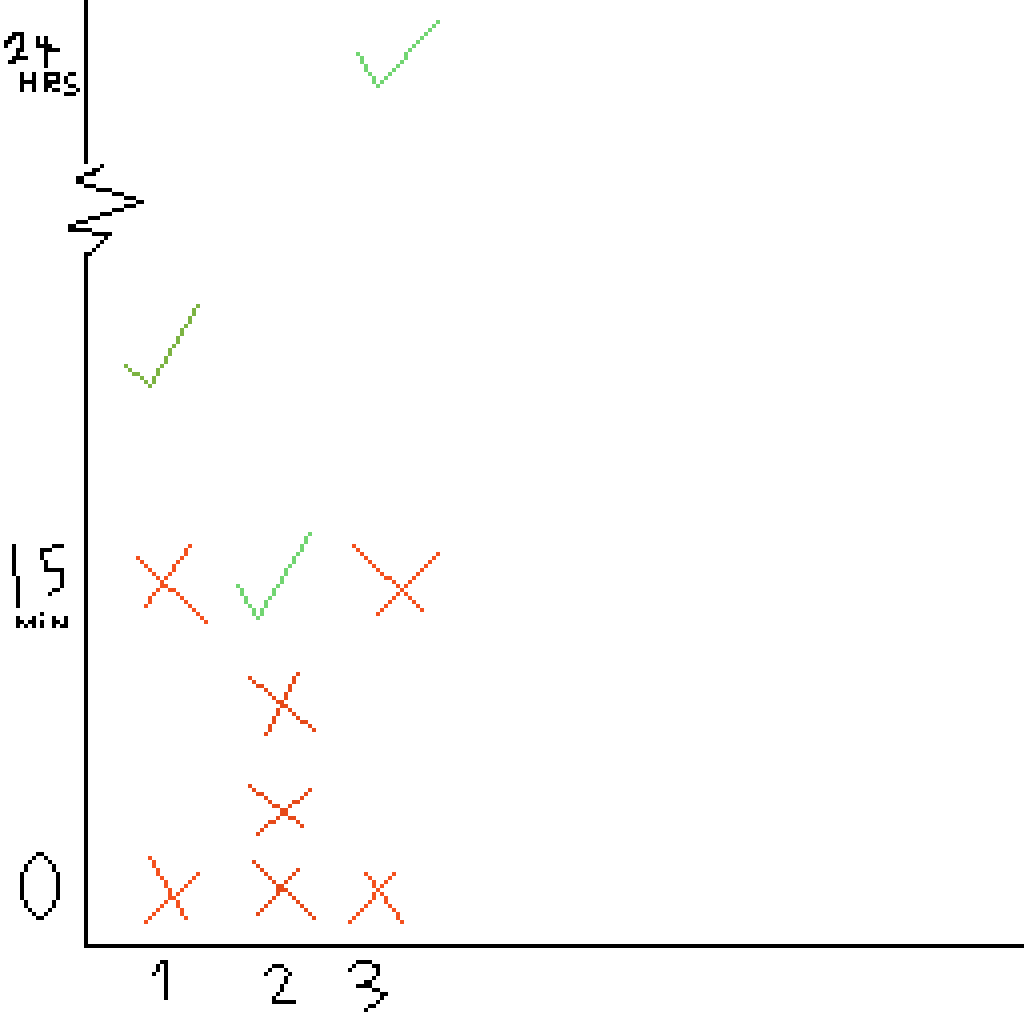
To make analysis simple and easy for admins, we would have to pick a chart for the page that would be easy to read and easy to draw analysis from. We went over many different types of charts, including bar and line graphs, but we settled on a modified dot plot to both show the number of attempts on a particular question, but also the time between attempts. Since the X axis would be in order, it could also show trends within categories. We then made a mockup of this idea as pictured here, which we have further refined into something we will show off specifically on Tuesday.
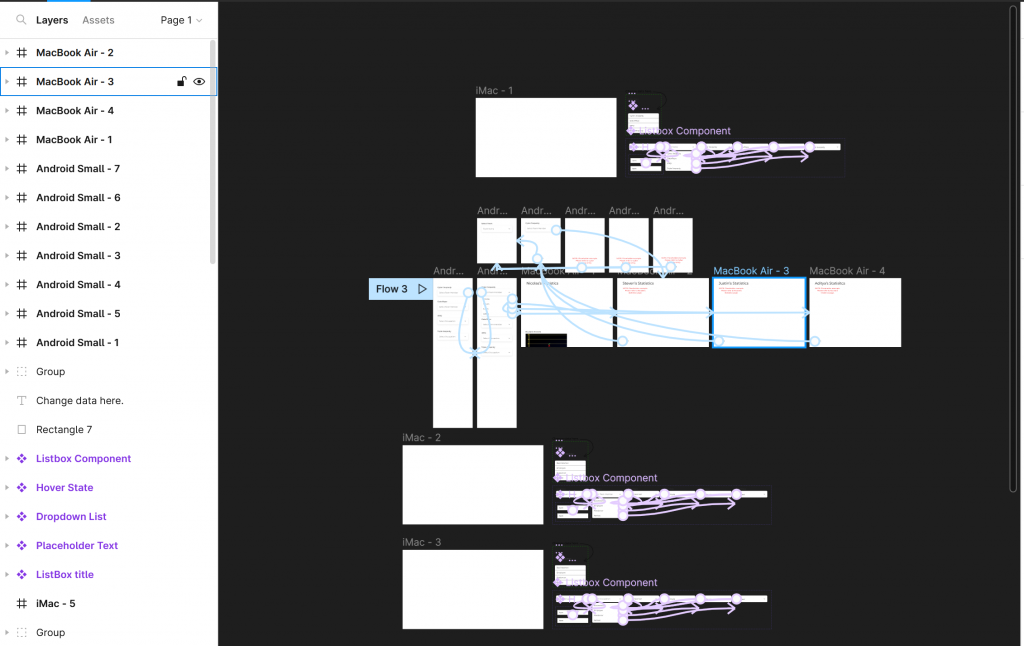
From there we needed to create a concept for the analysis page as a whole, in order to do this, we used the website Figma which allows for functional prototypes with interactive elements. This will allow us to showcase our designs for the analysis page smoothly with the judges on Tuesday and get feedback on overall design. The important part about using Figma is that we can get feedback on how it “feels” to use rather than just how it looks, since people can actually test out the design.