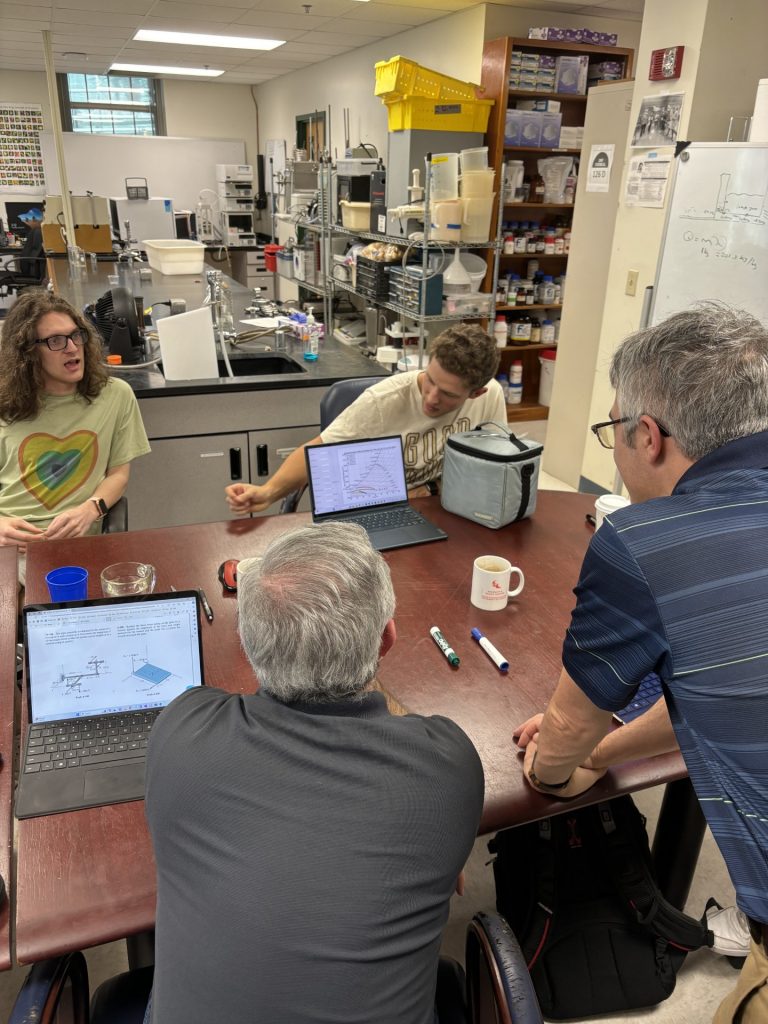
The DesiGators made two massive leaps forward in their project – with the first milestone being the integration of plots into the GUI. The new GUI can now take a data set and produce a plot onto a psychrometric chart. This tool will prove invaluable to the students using the device as they will be able to actively monitor the drying process.

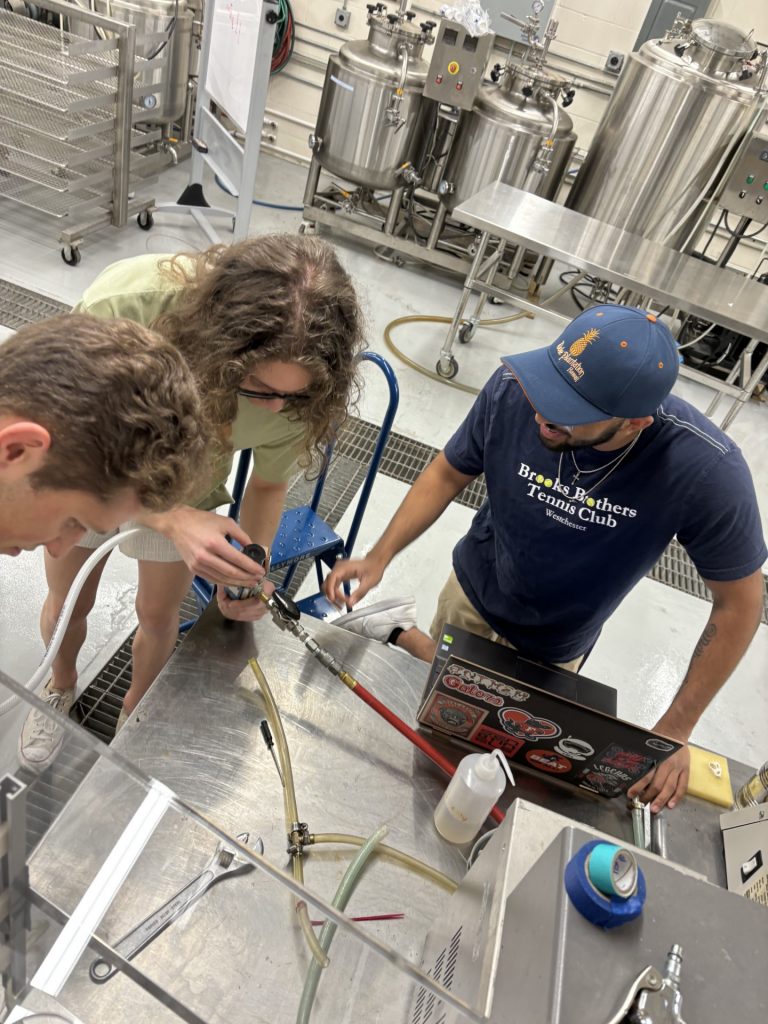
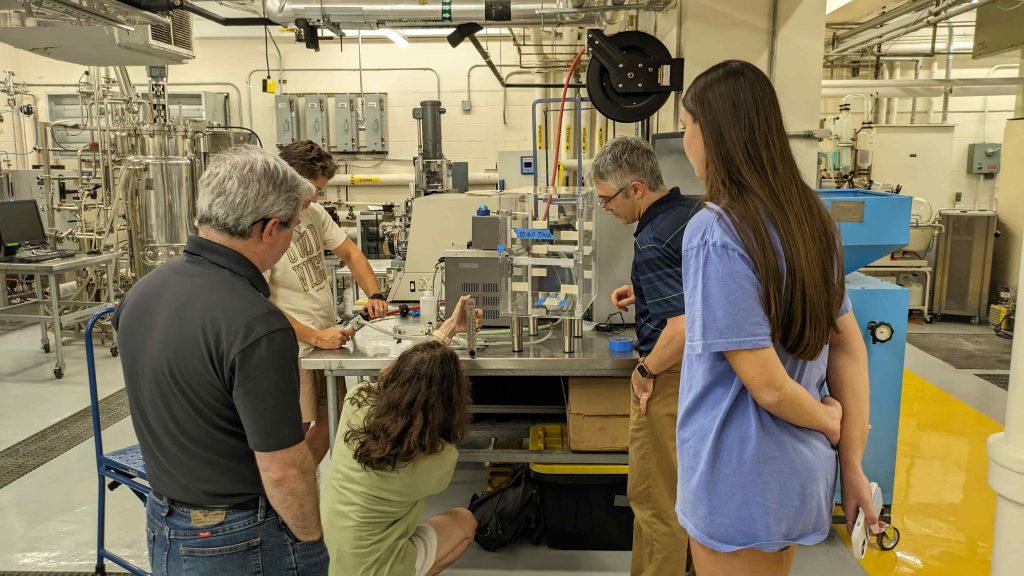
The next big milestone was the delivery of the rotameter used in the air handling subsystem. The team tested the instrument with the Pilot Plant’s compressed air line and soon realized they had succumbed to every engineer’s biggest nightmare – units. Due to an error early in the design process, the units used in some preliminary calculations were incorrect. The result was an airflow that was much faster than desired which would result in a less educational drying lab. Although the setback was not desired, the team adapted quickly and already has plans to rectify the situation and continue pushing strong. As a reminder to engineers everywhere, check your units!