This week our team shifted gears towards research and data preparation for a bigger picture: the system architecture.
We spent a lot of time together at the whiteboard, sketching out how all the pieces connect to our platform. The session went collaborative and lively; we debated over flows of data, clarified what belongs inside the system, and agreed on all the external factors. Revit for lighting asset data, facility managers and technicians as our users, energy usage feeds, and the ML models powering predictions.
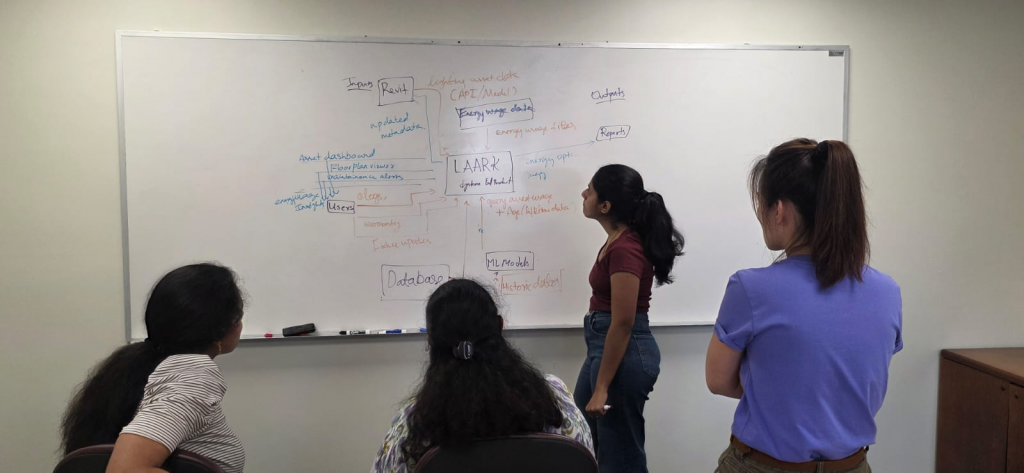
This session brought different angles to the discussion. While some of us focused on technical data flows, others emphasized on usability and how the users interact with the system. This mix of perspectives helped us get to the bigger picture with practical details, and made sure that our architecture isn’t functional on paper, but also has a meaningful purpose.
After a long session of redoing things over and over we finally had a System Control Diagram that gave a structure for our project, which highlights the importance of data, generating predictions, producing reports, floor plan overlays, and maintenance alerts. This makes sure that we all are on same page among ourselves as well as with liaison.
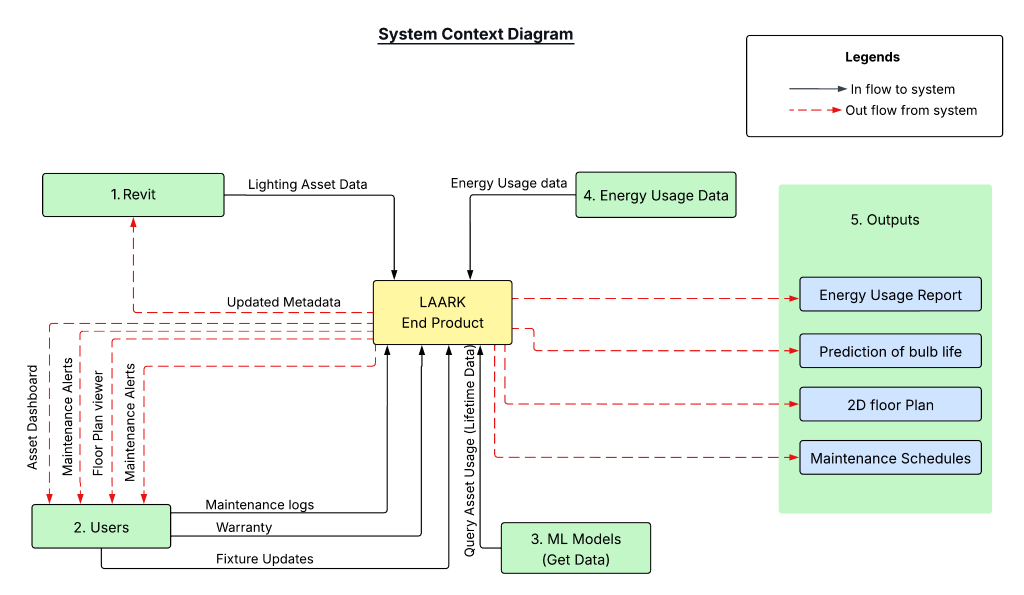
What stood out most for us is the clarity we gained from this exercise. Instead of jumping directly into the code and ignoring basic features, we now have a top-level blueprint that anchors the whole project. It also surfaced important questions which we will be tackling further, like how to gather historic data, what should be the features for our prediction model, and what type of graphs should the energy dashboard contain.
MOVING FORWARD!!!
We look to refine this architecture and start mapping the concrete tools and components. This will bring us closer from generating the high-level design to actual dashboard elements and predictive maintenance workflows.