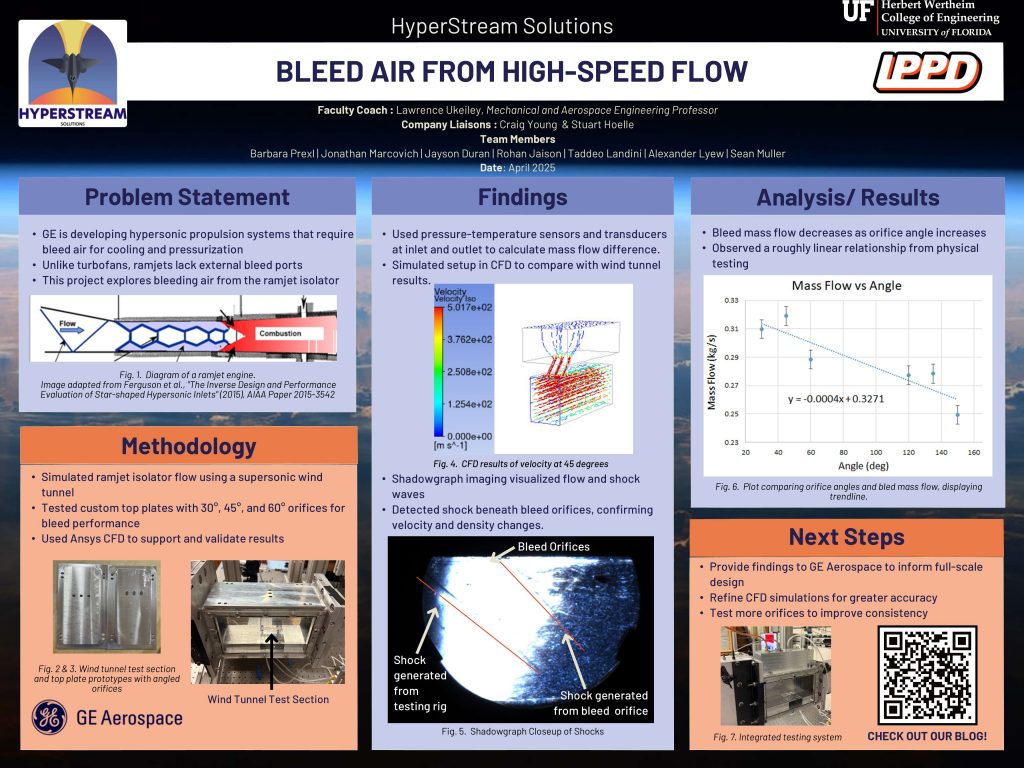
As a final conclusion, the team put together this poster and video to summarize the details of the project including who, what, where, when, why, and how we did it. We hope you enjoy!
As a final conclusion, the team put together this poster and video to summarize the details of the project including who, what, where, when, why, and how we did it. We hope you enjoy!
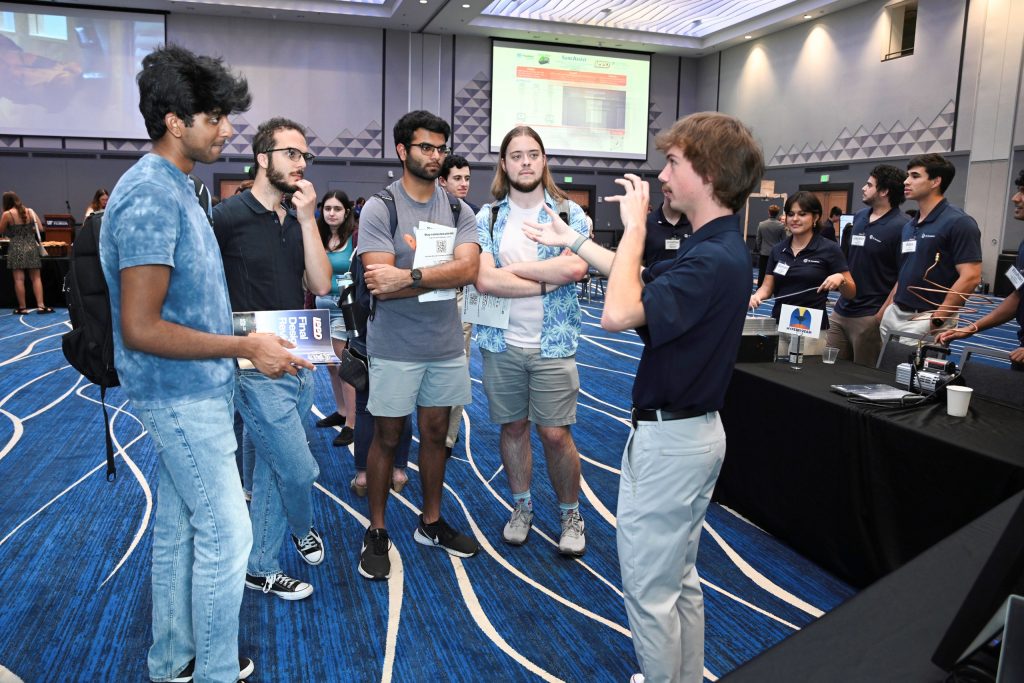
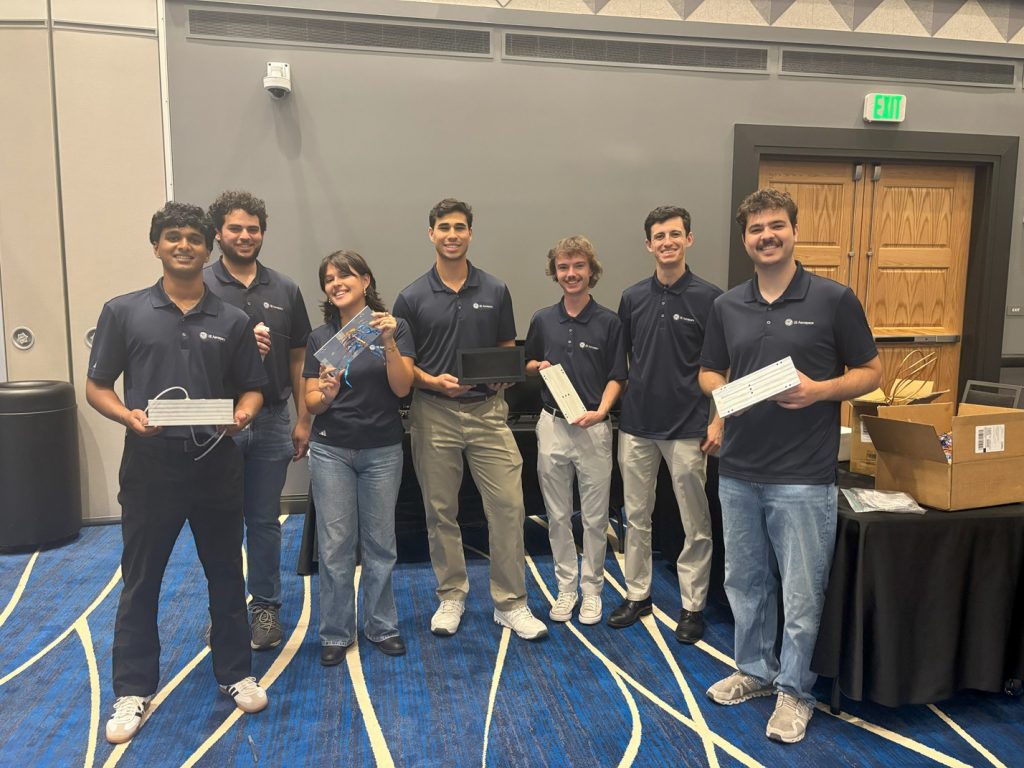
Welcome to the final blog post from Hyperstream Solutions. This past week we had a great time presenting our work during both the public and private showcases at the Final Design Review. It was a rewarding experience to share our project with fellow students, team coaches, faculty, and experienced engineers, and we’re incredibly grateful for all the positive feedback and thoughtful compliments we received. Our final presentation went smoothly, and we were asked some insightful questions that sparked great discussion. Overall, it was an amazing experience, and the lessons we’ve learned throughout this process will stay with us as we move forward in our academic and professional careers. It’s amazing to reflect on how far we’ve come as a team, especially considering we met less than a year ago.
Our project began with a vague question: what is the impact of bleed air on a dual-mode ramjet engine? Like many of our readers, we had never heard of either term. After weeks of research and talking to professors, we started shaping a project that could be analyzed at UF. We scaled down the original scope to fit within the capabilities of our small supersonic wind tunnel. After several design iterations and many discussions, we shifted from varying orifice shapes to varying angles, which turned out to be more practical and relevant for industry applications. We presented this direction at the System Level Design Review (SLDR) at the end of 2024.
Once finalized, our design included two main parts: three interchangeable top plates and a shared manifold. We used a CNC mill to manufacture the manifold and the plate frames. The angled holes, especially the 30-degree ones, were tricky to drill due to clamping and bit deflection, but we eventually got them done.
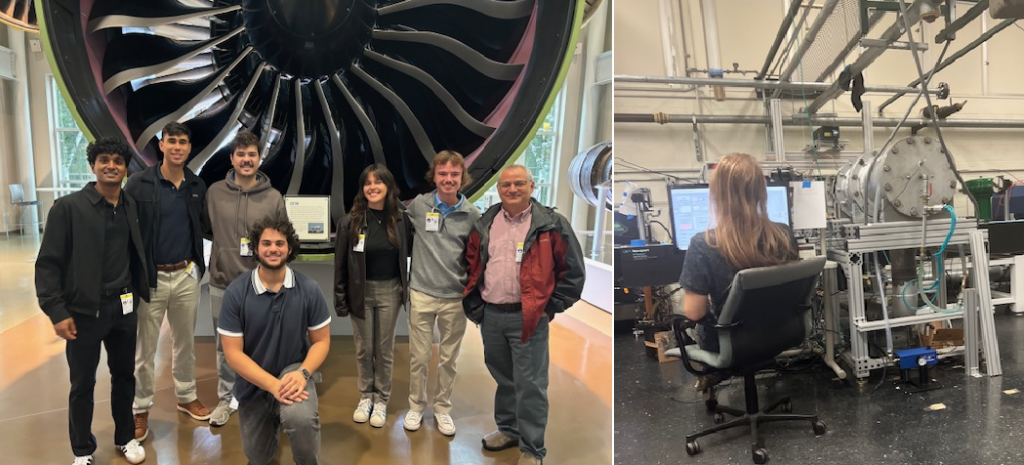
Testing was a new and rewarding experience for most of us. Preparing the setup and running the tests took time and care. After our first round, we gained confidence and insight, which helped during the second, longer test session. With all data collected, we began analyzing results and compiling our findings.
Looking back, it’s incredible how much we’ve learned. We started without knowing the basics, and now we’re presenting original research. This experience has been both challenging and rewarding, and we’re grateful for every part of it.
As we approach the end of the semester, our team is preparing for our Final Design Review. This event marks a major milestone in our project, giving us the opportunity to showcase everything we’ve worked so hard on. We’ve created a video and poster that highlight our objectives, testing, and results, and we’re excited to present them during the showcase portion of the event.
The review also includes our final presentation, which we’ll deliver to a panel of engineers from GE Aerospace along with faculty and other guests. We’ve worked hard to ensure our presentation not only demonstrates the technical depth of our work but also the collaboration and problem-solving that brought it all together.
In addition to the presentation, we’ve compiled a comprehensive final report that documents our entire design process, testing methodology, results, and key insights. This report will be sent to GE Aerospace as a research package, with the goal of supporting their future work in this area. We hope it serves as both a useful technical resource and a reflection of the effort our team has put into this project.
We’d like to extend our thanks to our sponsors and advisors for their guidance and support throughout the semester. It’s been a long journey, and we’re proud of how far we’ve come. We’re looking forward to closing out this project on a strong note and sharing everything we’ve accomplished.
This past week, our team has been hard at work finalizing our uncertainty analysis and running the last rounds of Ansys simulations. With those nearing completion, we’re shifting gears to focus on how we’ll present our project to the public through a video!
We’ve taken inspiration from journalists, aiming to put the viewer directly in the shoes of someone facing the problem we set out to solve. Our goal is to make the technical feel tangible and of course, in true HyperStream fashion, we’re sprinkling in a bit of humor to keep things fun and engaging.
Throughout the year, we’ve made incredible progress not only in developing our project but also in breaking it down in a way that’s accessible to a broader audience. This video will be the cherry on top, a creative, meaningful wrap-up of all our efforts.
Stay tuned as we begin drafting our final report and putting the finishing touches on our video!
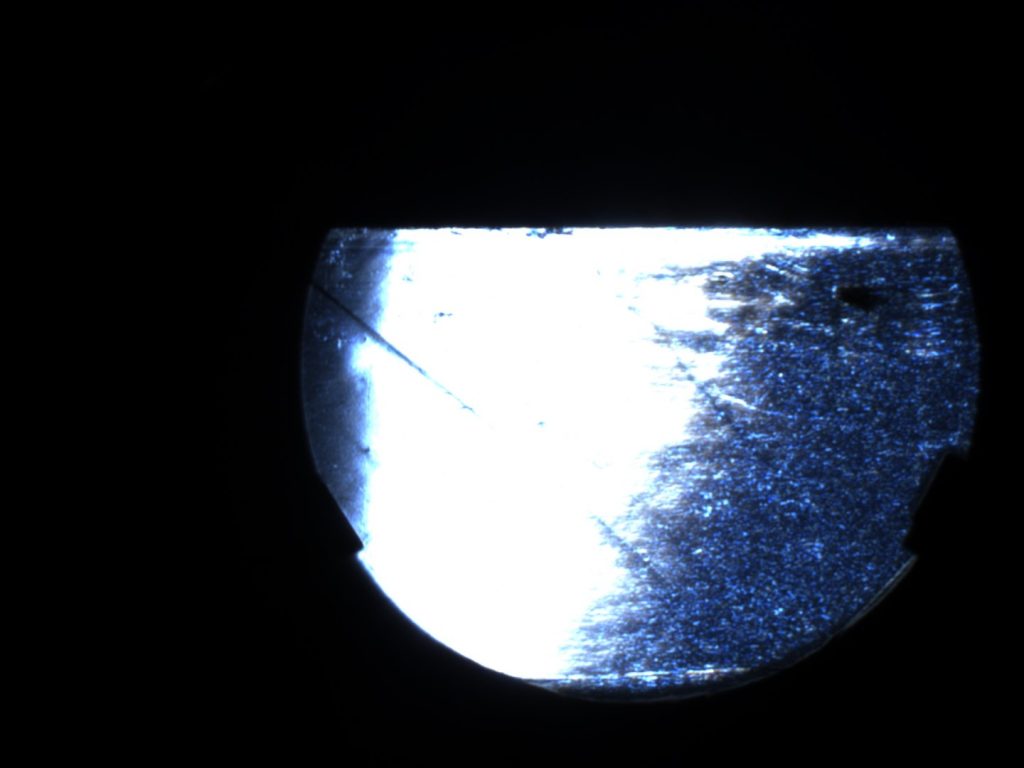
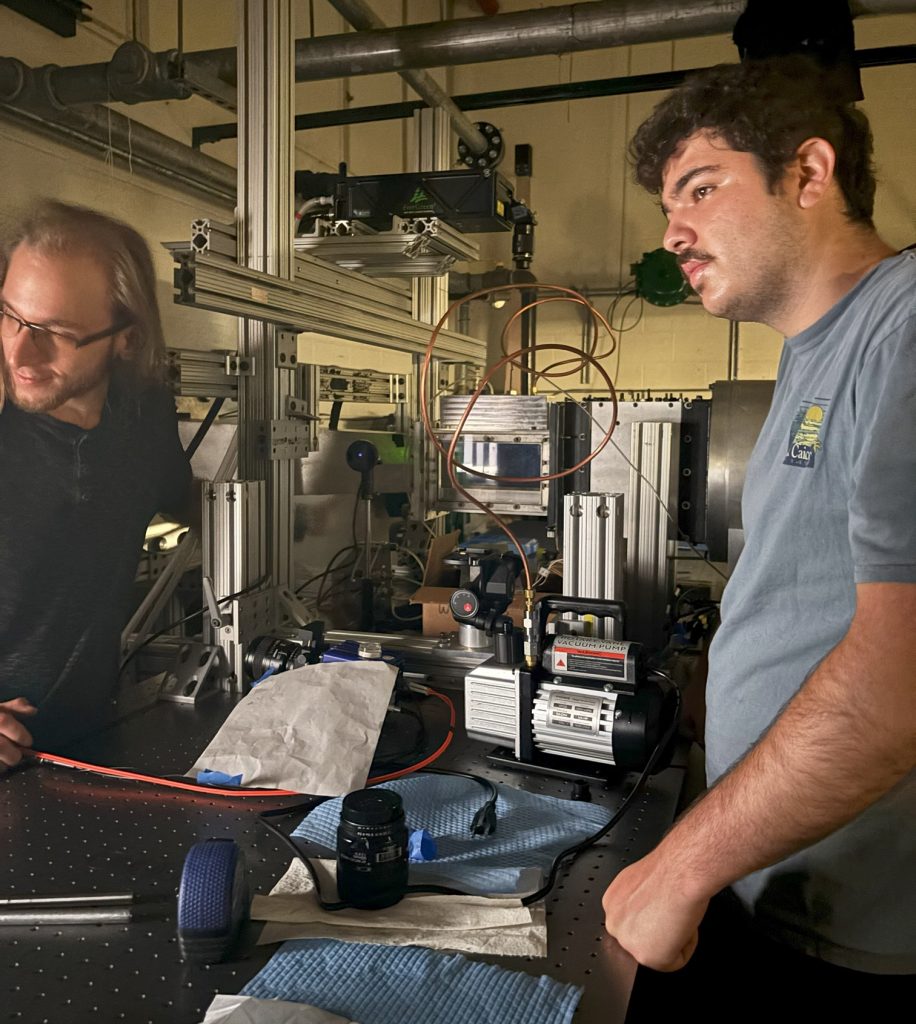
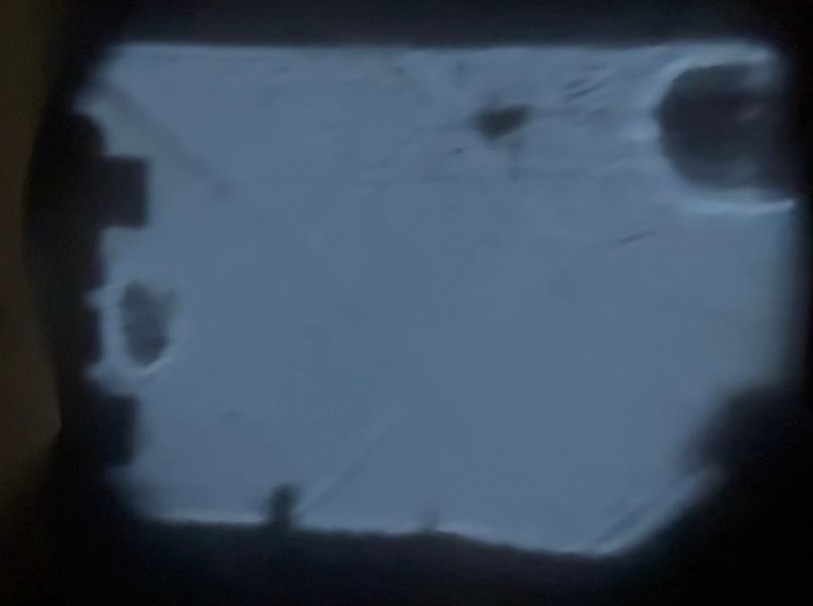
This past week was an exciting one for our team, filled with high-tech imaging, creative demonstrations, and valuable feedback. Our first order of business was to capture a higher-quality shadowgraph image to better visualize the flow behavior in our prototype. Previously, we relied on phone cameras, but this time we upgraded to a high-end camera that provided much clearer and more detailed images.
The results were fascinating! We observed two distinct shocks: one near our bleed holes, as expected, and another near the “lip” of our prototype, indicating a disturbance in that region. This discovery gives us deeper insight into the flow dynamics at play and will be a fantastic addition to our reports and presentations.
Speaking of presentations, we recently participated in our second Prototype Inspection Day (PID). Since our project is more data-driven and research-focused rather than centered around a physical product, we wanted to find a way to make it more tangible. Enter our genius idea: using a can of compressed air to simulate “supersonic” flow through our bleed holes! This helped our audience better visualize the airflow behavior we are studying.
The judges responded well to our presentation, praising our demo and engaging delivery. However, they also provided constructive criticism, pointing out details and discrepancies in our CFD analysis that we had previously overlooked. This feedback is invaluable, and we’re excited to refine our approach as we push full steam ahead toward our final deliverable: the Final Design Review (FDR)!
With improved visualizations, creative demonstrations, and actionable feedback, we’re making great strides in our project. Stay tuned as we continue to refine our work and take our research to the next level!
This week marked a major leap in our project as we completed the analysis of all top plate test data and finalized CFD simulations for every forward-tested angle, achieving a significant milestone in validating our aerodynamic models. We meticulously calculated essential parameters from our raw data, including exit pressure, manifold pressure, inlet pressure, pressure recovery, and mass flow bled, ensuring our dataset is both comprehensive and reliable. With data from experimental tests, we tackled uncertainty calculations for the 30-degree test plate using RSS and statistical methods, securing the accuracy needed to identify meaningful trends and correlations. Additionally, we are actively exploring ways to animate our CFD simulations by saving them as videos, bringing our computational results to life with dynamic visualizations. On the creative front, we finalized the storyboard for our project video, laying the groundwork for an engaging and informative presentation that captures the excitement of our progress.
Looking ahead, we’re focused on refining our visuals by capturing higher-quality shadowgraph images and conducting CFD simulations for reversed and non-tested angles to fill data gaps and enhance our understanding. We’re also documenting and plotting our test data to uncover key correlations that will give us deeper insights into aerodynamic behavior and performance. As we continue making strides in both data analysis and visualization, the project remains on schedule, and we’re eager to keep pushing forward—stay tuned for more breakthroughs and captivating updates!
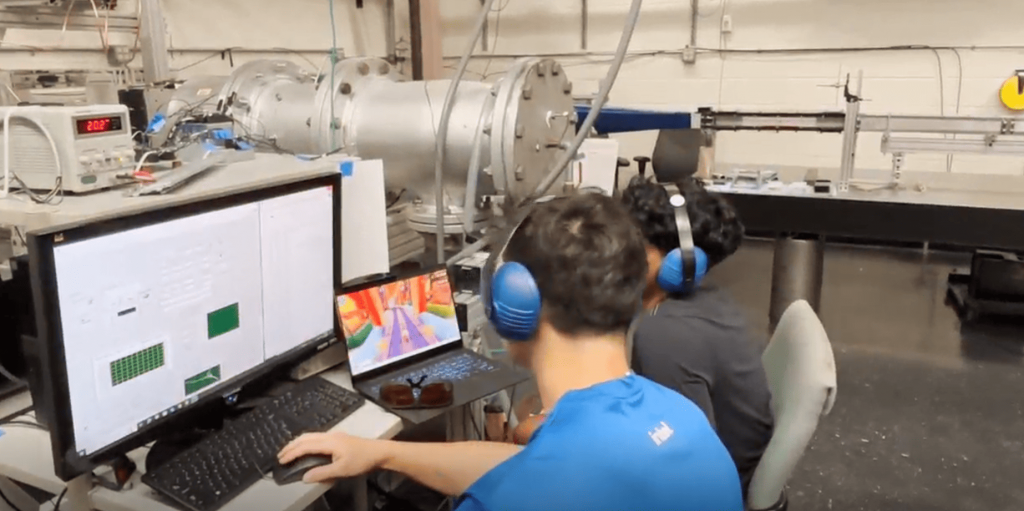
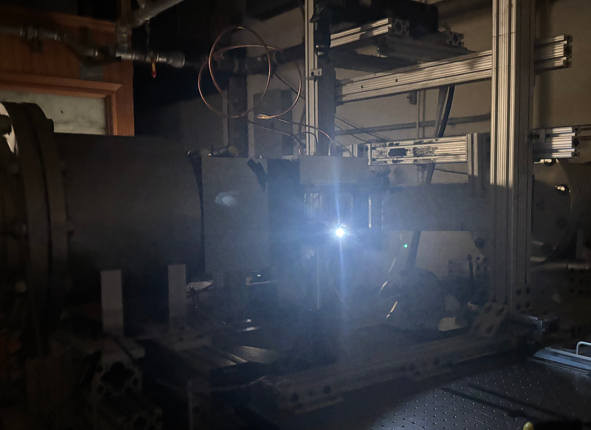
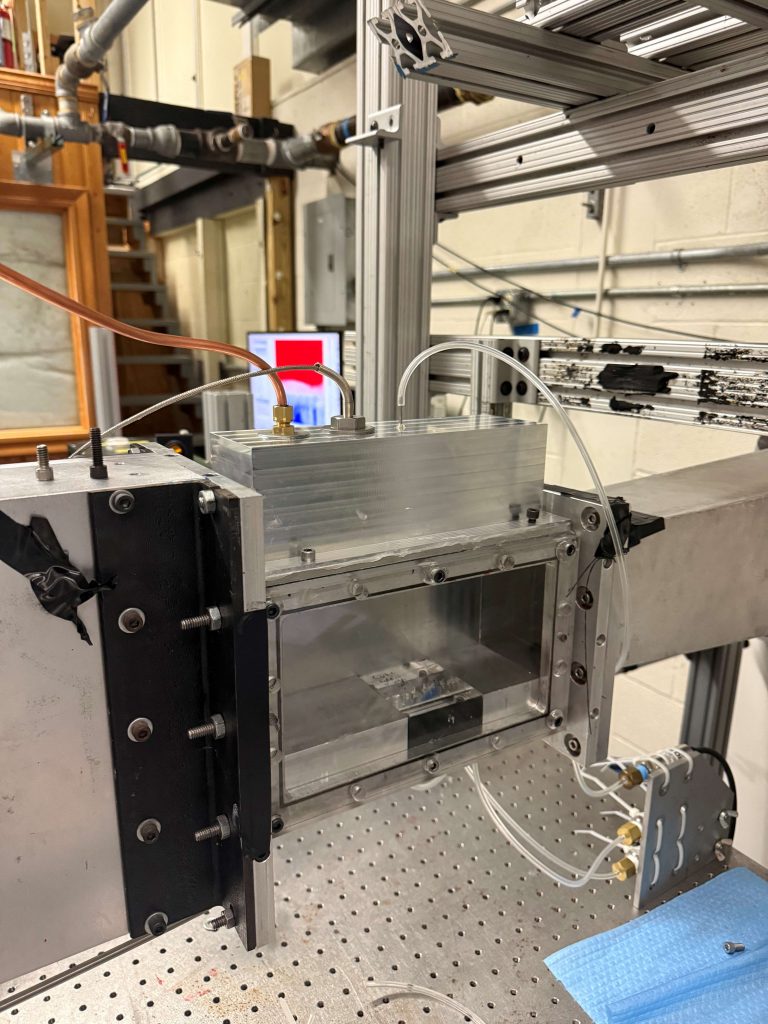
This week, testing continued at full speed ahead! Now that manufacturing has been completed, the manufacturing subteam was hard at work testing our top plates. Two weeks ago, a preliminary test was conducted on the 45-degree orifice top plate to ensure all of the systems and measurement instruments functions as intended. After we ironed out some of the kinks for testing, the remaining top plates were tested this week. In order to test even more angles, the top plates were also tested in reverse. With this week now wrapping up, we’ve officially ran tests for 30 degree, 45 degree, 60 degree, 120 degree, 135 degree, and 150 degree conditions. Very excited about this progress, and looking forward to analyzing the results in the near future! Below is a picture of the imaging used during one of our tests.
On the CFD front, our ANSYS subteam continued to improve upon the conditions of the simulations. We ran into some hurdles while updating the designs to better match the experimental setup in the wind tunnel. Time was dedicated to fixing the updated simulations this week. The new designs ended up being more complex than the old ones, so more simulation time was required. Also, some of the initial conditions and boundary conditions needed changes. As these fixes are made, the simulations are getting closer to giving data from simulations that match our experimental setup. The goal is to compare this the wind tunnel and ANSYS data, then utilize ANSYS to test even more conditions than we have in the wind tunnel!
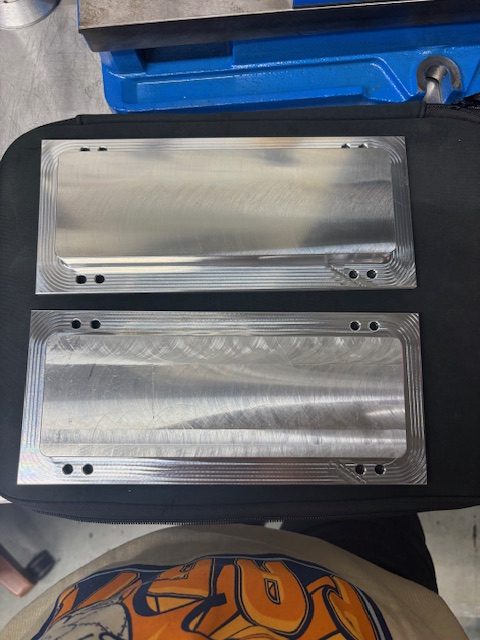
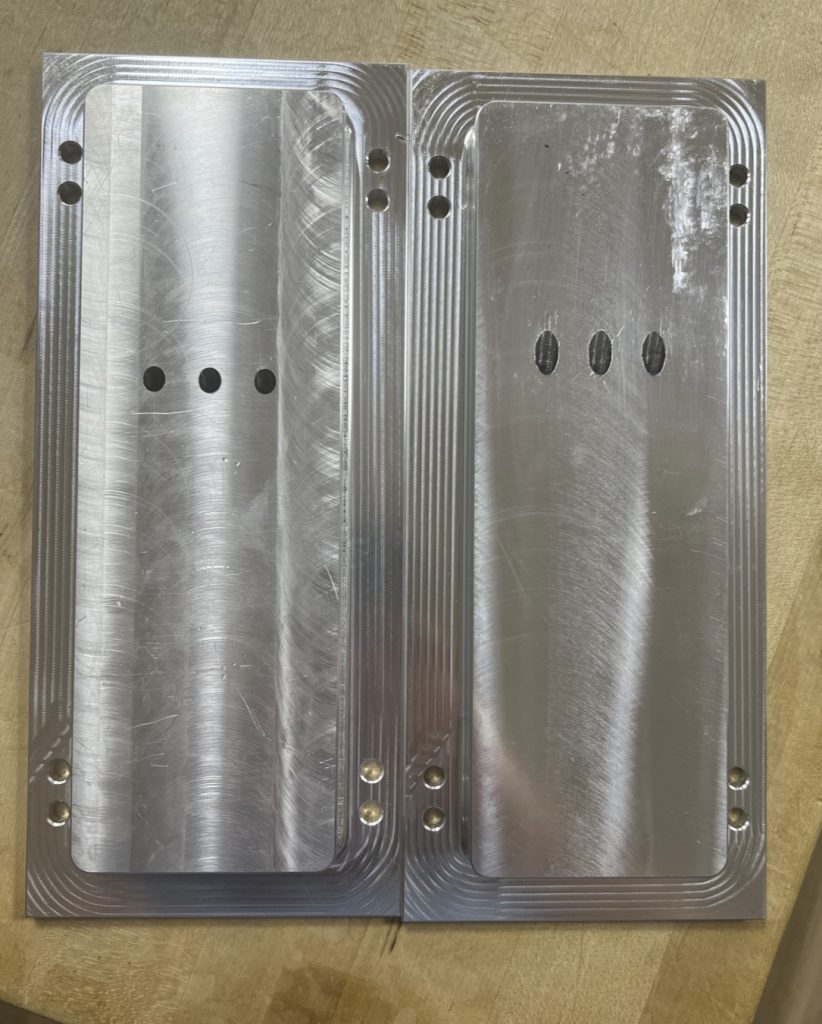
This week, we completed the manufacturing of two additional top plates and confirmed the fit in the wind tunnel test section! The first of these plates contained orifices angled at 60-degrees, while the second contained orifices angled at 30-degrees. With this important step, we have finished manufacturing our top plates with angles of 30, 45, and 60-degrees, and are ready to focus on testing the two new plates with the same experimental configuration as used for our 45-degreee orifices. Seen below are the 30-degree and 60-degree orifice top plates shortly after the conclusion of our manufacturing!
Additionally, the computational fluid dynamics sub-team spent time ironing out the initial conditions based upon our previous results and a collaborative discussion with an engineer at GE Aerospace. With this, we will ensure that our current simulations are updated to properly reflect the conditions of the wind tunnel test environment in the lab. By properly matching these conditions, we will be able to validate the accuracy of the numerical solution to the experimental data for matching orifice geometries before moving on to expand the simulations into geometries not tested by the experimental set-up!
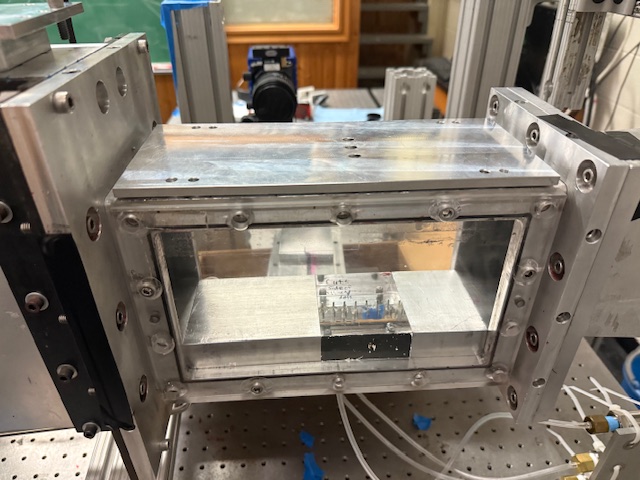
This week, we conducted our first test in Dr. Ukeiley’s wind tunnel lab. After verifying the fit of our components and making necessary adjustments, we installed our first top plate in the test section and mounted our manifold above it. Using two pressure transducers and a temperature sensor, we collected data to determine the mass flow bled through our 45-degree orifices. As a control, we also tested a top plate without bleed orifices.
The results indicated that we were bleeding less flow than initially expected based on our original project goals. However, we decided to redefine our objective by focusing on mass flow per orifice rather than total mass flow, considering that our test apparatus is at a smaller scale than the isolator it represents. Given the larger surface area of the isolator, additional orifices could be added to achieve the intended mass flow. Moving forward, we plan to test our 60-degree and 30-degree orifice top plates and, depending on available time, explore flipping each plate by 180 degrees or increasing the number of orifices to gather more data.
Meanwhile, our ANSYS team has been refining the initial conditions of our simulations based on feedback from our coach and previous results. With the new experimental data, they will update the simulation conditions to better reflect the lab environment and aim for similar results. This validation process will help ensure accuracy as we explore new combinations of angles and orifices in future tests.
This week marks a major milestone in our project as we transition from manufacturing to testing! After weeks of hard work, we’ve finalized our fittings and successfully secured our first top plate onto the wind tunnel test section. With the remaining plates CNC-machined, our next step is to drill the angled orifices—an exciting challenge that will follow our initial test. We’ve refined our study to focus on 30-, 45-, and 60-degree angles, a strategic adjustment based on manufacturing constraints discovered during fabrication. If time allows, we’ll also flip the 45-degree plate to gather data on forced airflow through the orifice, adding another layer of insight to our study.
Meanwhile, our ANSYS team has made significant strides, mastering the software to generate detailed simulations. These models will be crucial for comparing our experimental transducer data, ensuring accuracy and deepening our understanding of air bleeding in supersonic flow. With testing on the horizon, we’re eager to uncover new insights. Stay tuned—things are about to get exciting!