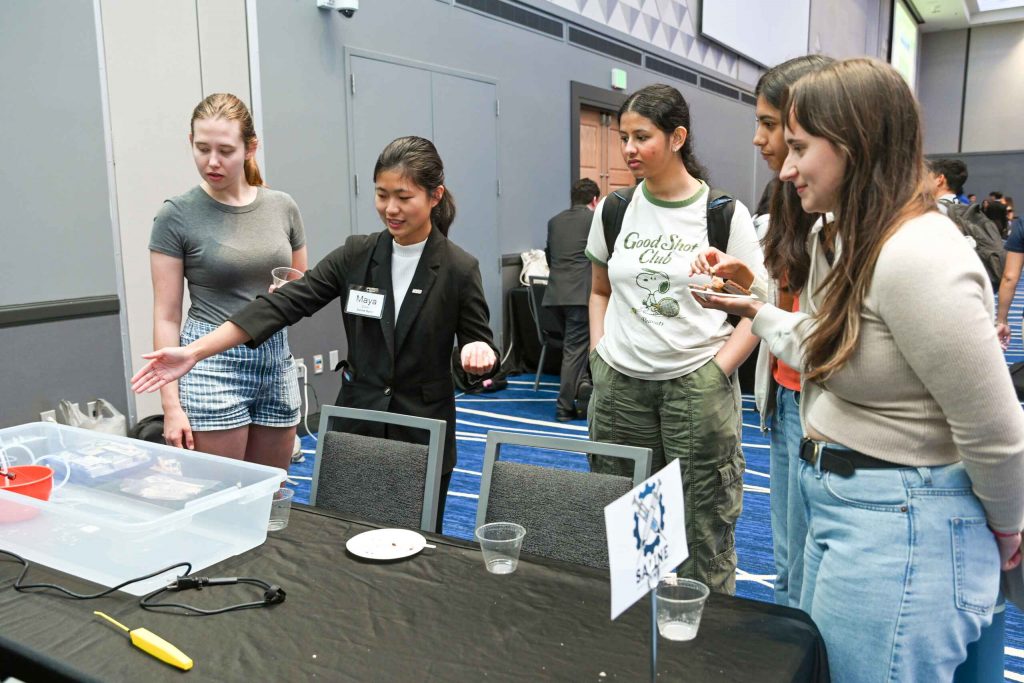
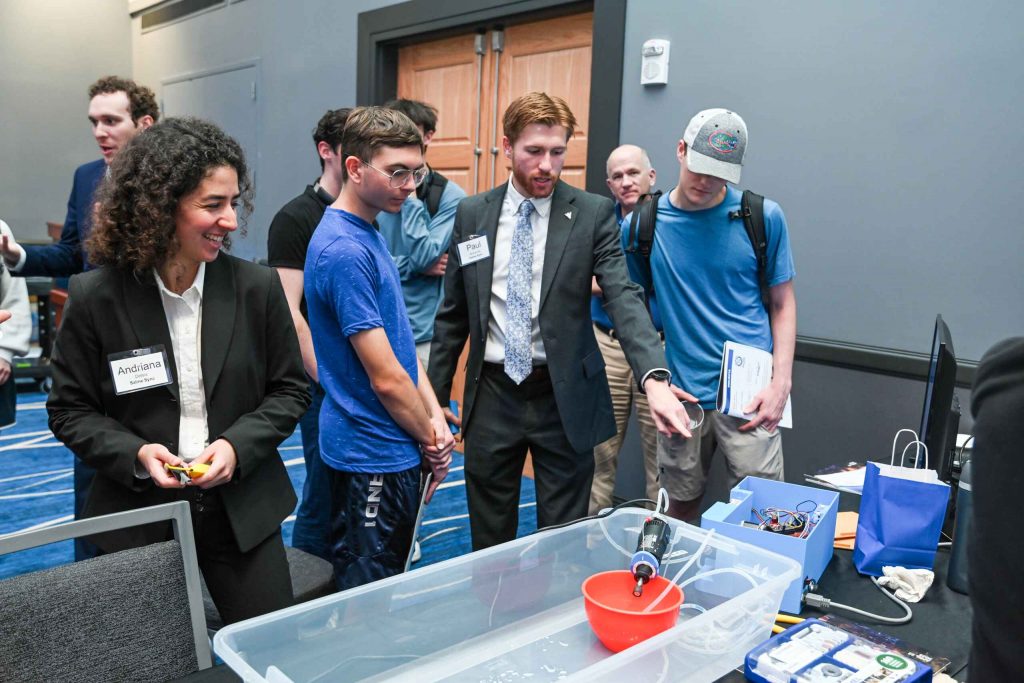
We had the unforgettable experience of experiencing FDR at both UF and Arthrex this past week. At FDR at UF, we presented our device to both Arthrex and GE Aerospace within the team presentations showcasing all the work we did throughout the year including a models of the system, details of the electrical mapping, testing results, videos of the system in use, and recommendations that we have for Arthrex once they take this project. We got to showcase our device to the public during the public demonstrations of the event. This gave us the opportunity to show our friends, family, and peers our project that we worked on for the past 9 months.
These are all images from our FDR at UF experience! (Photos curtsey of Dave Schlenker)
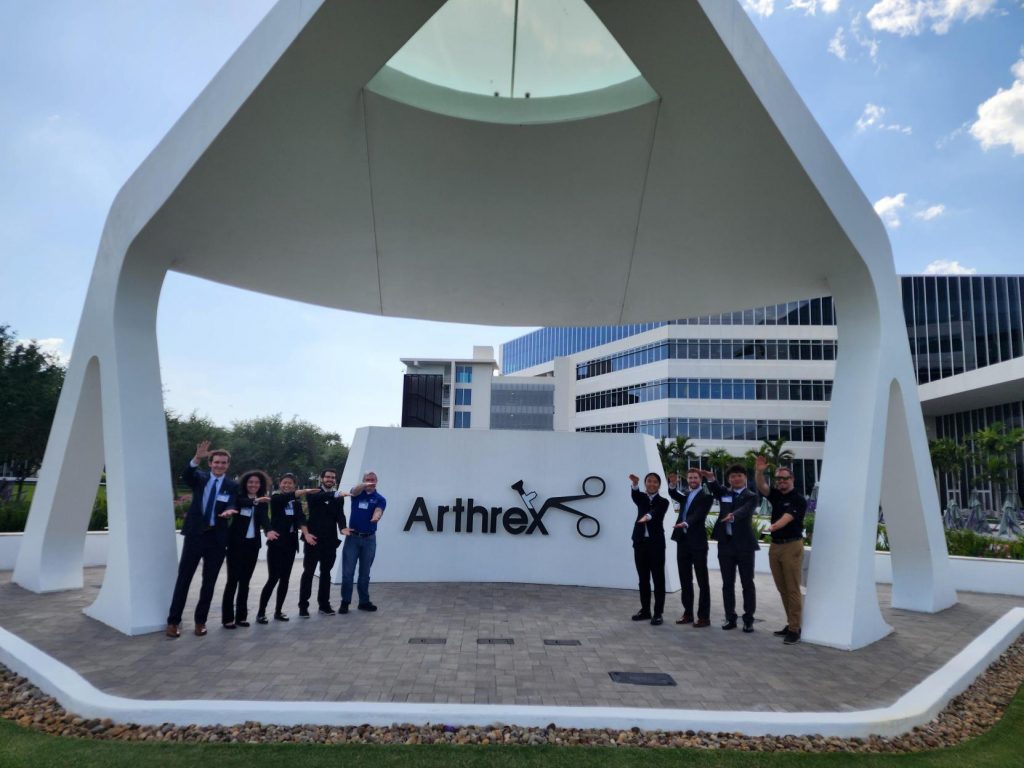
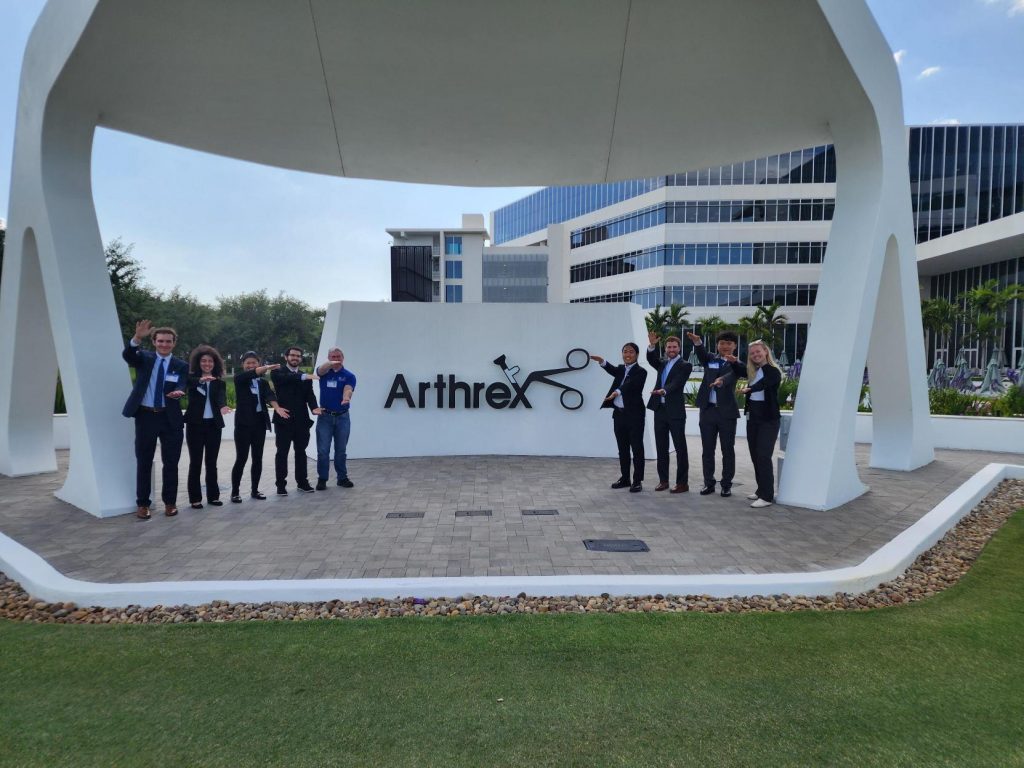
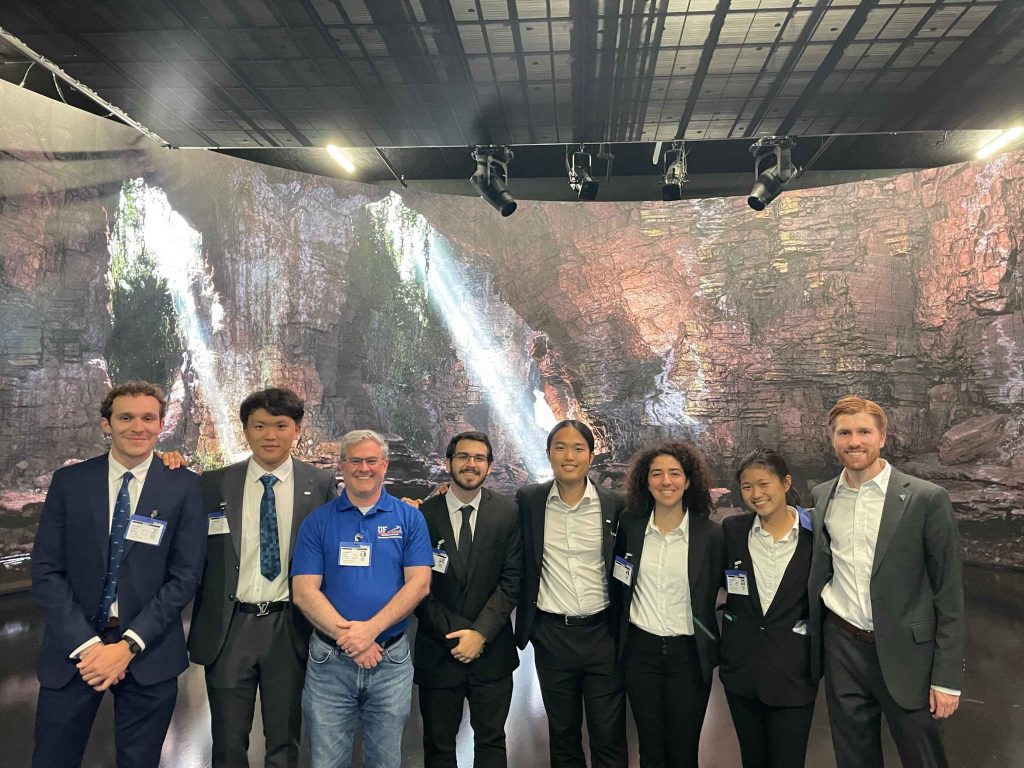
At Arthrex, we were able to present and demonstrate our project to Arthrex engineers and showcase how Arthrex may take on this project as their own. We were also able to get a tour of Arthrex Studio X, which is the home of their state-of-the-art media production technology that furthers their own investment and commitment to providing the medical education resources of the highest quality to healthcare professionals around the world!
Saline Sync at Arthrex!
With that, we would like to say thank you to Arthrex, IPPD, Troy Garrison, Elizabeth Wildsmith, Dr. Jackson, and everyone who has helped us along the way. This was an unforgettable and fulfilling experience that we will take into our own careers after we leave UF.
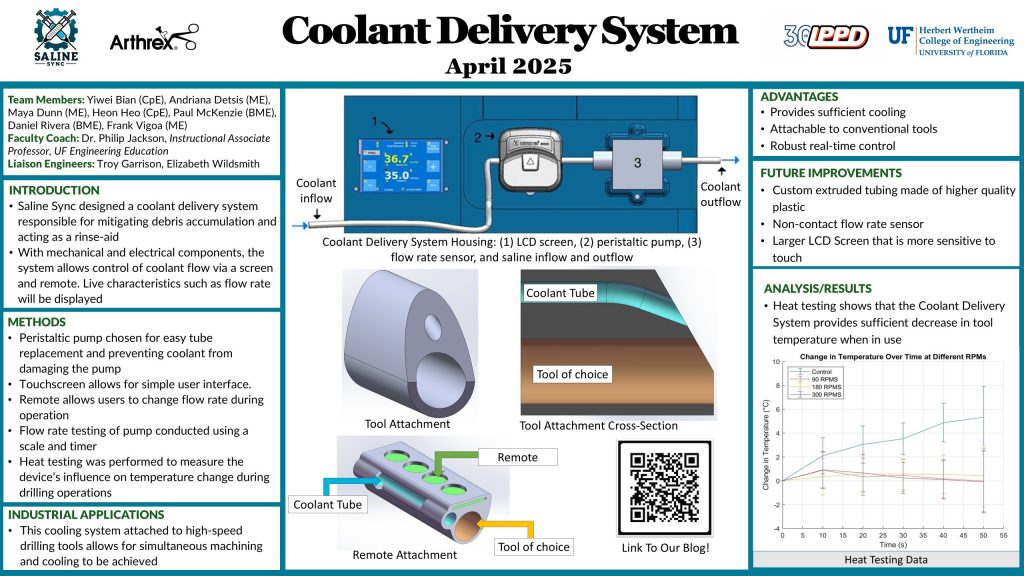
FDR is tomorrow! The team is super excited to show off our devices to everyone, so here is our FDR poster and video ahead of time! The poster goes over the project background and details the applications of our product. The video demonstrates how the device may be used for a Dremel rotary tool.
As we ramp up to finish our project, we have been making some final finishing touches, which have not led to the best results. Despite difficulties, we are still on track to deliver a finished proof of concept prototype!
FDR Peer Review
At the FDR Peer Review event, our team presented our PowerPoint and received great feedback. We were able to communicate our results better this time around than in past presentations, which is a huge accomplishment for us since explaining medical terminology has always been a pitfall of our presentations. We did receive constructive feedback that will help us greatly improve that understanding, which we plan to implement next Tuesday and Thursday when we have our FDR presentations. Finally, our presentation skills have greatly improved from the beginning of the year, and we are excited to present the fruits of our labor next week.
Two ESP 32’s Led to Major Issues
Last week we installed a second ESP32, which would help us achieve better communication with our pump. When we tested our system this week, though, the flow rate sensor completely stopped communicating with our system, and the pump also would not work consistently. These problems can be mitigated, but the question is now, “Can we get our system back up running the way we want it to by Tuesday?” Our backup plan is to revert to our singular ESP32 setup, which would give us less flow rate accuracy, but would at least give us a more reliable electrical setup. Regardless, we will have a working prototype to present to Arthrex, but the possibility of not having a working flow rate sensor is a disappointing one.
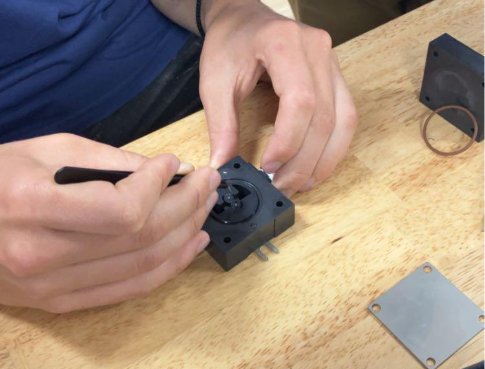
On Thursday, we opened our flow rate sensor to see if any mechanical issues were occurring, and we were able to fix a small jam between two gears in the sensor. Electrically, the flow rate sensor is still MIA. On the bright side, we were able to get our pump working consistently!
How ‘bout those Gators!? Like how the basketball season has ended (Gators won the national championship), we are close to the end of the IPPD season. With FDR in under two weeks, the team is smoothing the rough edges of the project and in the process of drafting the FDR report.
The Final Housing
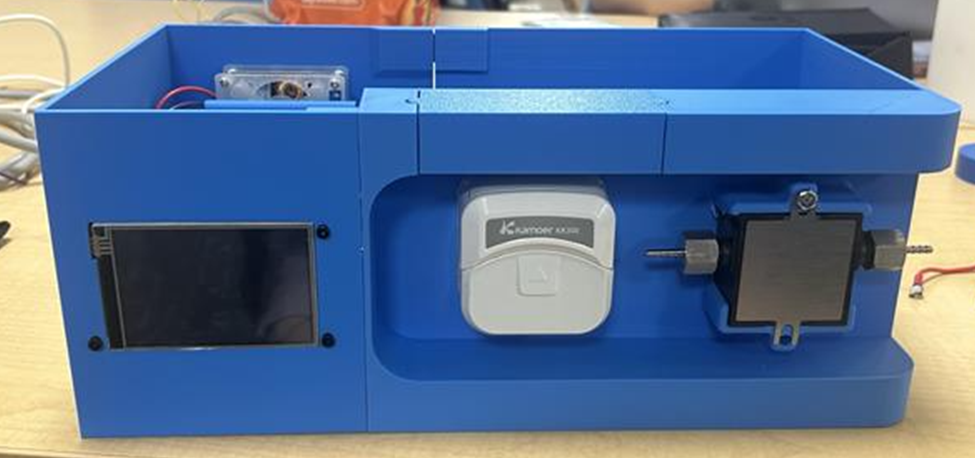
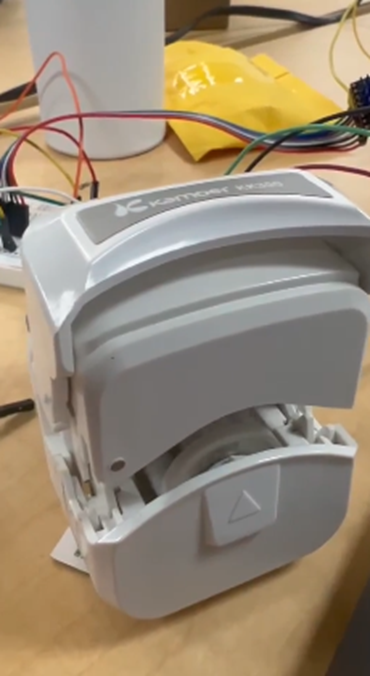
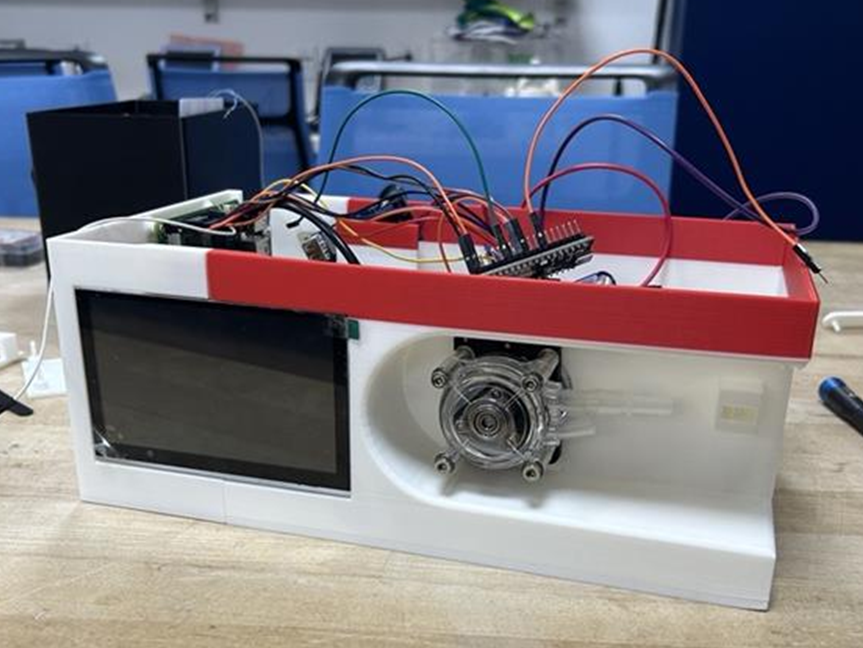
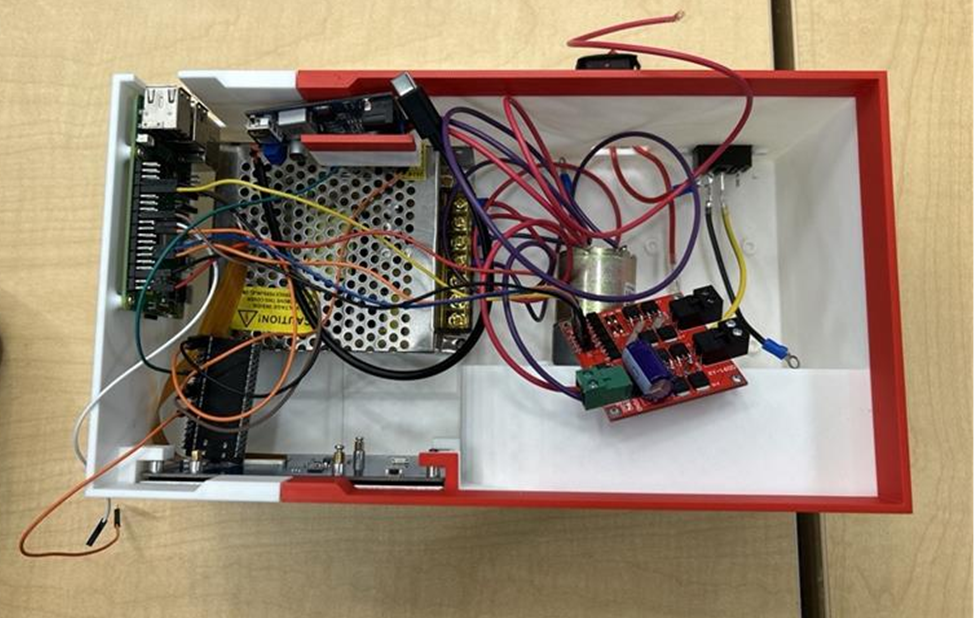
The final housing has been modeled and printed! The model was designed such that the housing could be printed as two halves. The two halves were necessary only for our own model of the system as our printers are unable to print the entire housing due to its size. Once we hand this off to Arthrex, we will recommend the housing not to be split in half or 3D printed to allow for mass manufacturing. The housing includes fixture mounts for each of the electrical components as well as a lid to the pump to open and close.
The final housing print with electronics installed
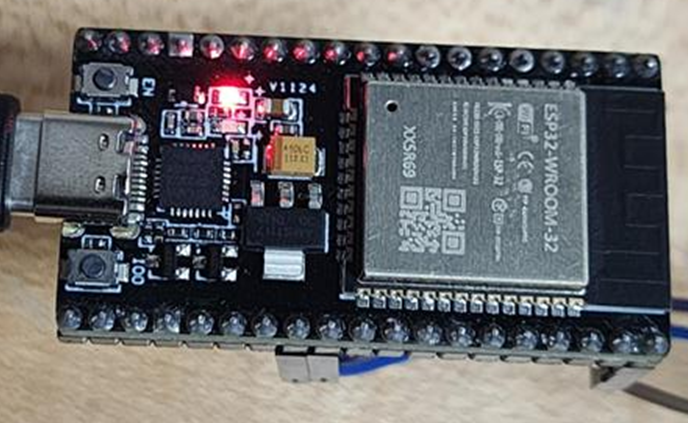
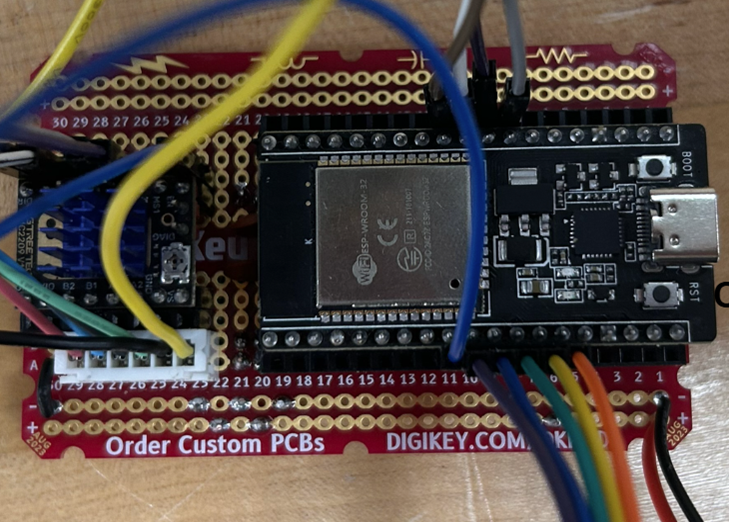
Not One, But Two ESP32’s
Results from flow generation testing proved that the standalone pump module reaches the higher RPM consistent with the step, while the integrated pump module does not reach the desired RPM. This led the electrical team to install an additional standalone ESP32 that will be dedicated to pump control. More specifically, one ESP32 will be used for motor stepping and removing advanced functions of TMC2209 to improve accuracy, whilst the other ESP32 will be used for sensor reading, Nextion communication, the remote control, and PID control. With this solution, improvements to the system include dedicated step timing, UART offload from the first ESP32, and achieving a modular system.
Prototype Inspection Day is finished! The team received valuable feedback concerning presentation skills, functionality of the device, and data analysis methods. The team will be focused on speaking more loudly and slowly during our presentations to ensure we are heard more clearly. We will also ensure to test our device multiple times before the Final Design Review for functionality as our device ran into technical issues during our first demonstration. Our judges also advised us to incorporate statistical analysis into our test results to effectively communicate the successes of our project.
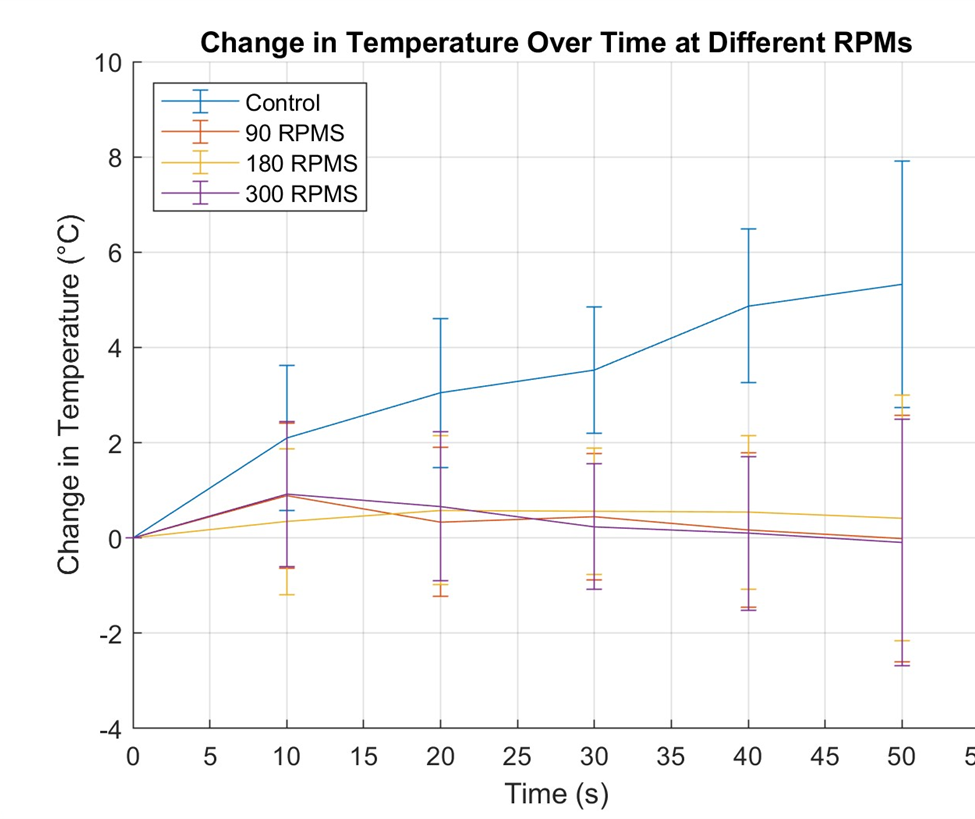
Results of the Heat Generation Test
The heat generation tests results are depicted below. Each plot point represents the average change in temperature at a specific point in time of 6 trials of the same RPMS speed of the peristaltic pump. The error bars represent the standard deviation of these averages taken. From these results, we are able to prove that our device does regulate temperature changes for drilling operations. We also discovered that with our device, the flow rate of the fluid does not have a significant change to the regulation of temperature. This could be beneficial for users as they may not need as much coolant used during drilling operations, saving them from having a larger mess as well as material.
Plot of heat generation test results
Assembling the Electronics
The electrical components are being assembled and fixed to one another to finalize the overall electrical system. This week, the PCB has been soldered into the system and the new buck converter associated with the power supply has been connected to the controller PCB. The team is now working on improving the software architecture in consideration of electrical components needs. For instance, The TMC2209 motor control and sensor input modules require continuous, real-time interaction, however, UART delays from the Nextion display may interfere with these tasks. This can result in motor jitter, missed steps, or inaccurate sensor readings.
Prototype inspection day is coming up and the team is busy adding updates to our device to be as close to the final product as possible for the big day. The mechanical team finalized one tube attachment out of the two that will be included in the final product. The electrical team have successfully integrated the Nextion display into the system.
Finished Tube Attachment
One out of the two final tube attachment designs is finished! This design allows the tube to fit onto a thin rod and cool down the rod whilst it is in use. The design also has fluid move to one end of the rod to release coolant onto a targeted space. The coolant is fed into the attachment through another tube connected at the y-port.
Nextion Display
The electrical team has worked to integrate the new Nextion display into the system. The display is currently a one-way communication system with a regular operation limited to 400 rpm for the pump. The display can be controlled through the screen and a remote to allow the person operating a drilling tool to control the flow rate of coolant with the same hand.
Happy Pi Day (March 14th gives the wonderful date of 3.14)! The team has pushed forward with so many more improvements and testing for the system that we deserve some pie…
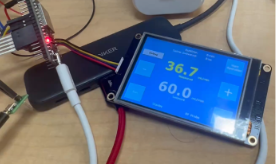
A New GUI
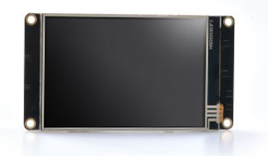
The electrical team has been developing the next GUI for the system. This new GUI component will replace the old LCD screen with a Nextion Enhanced 3.5” LED touchscreen.
Nextion Enhanced 3.5” from Amazon
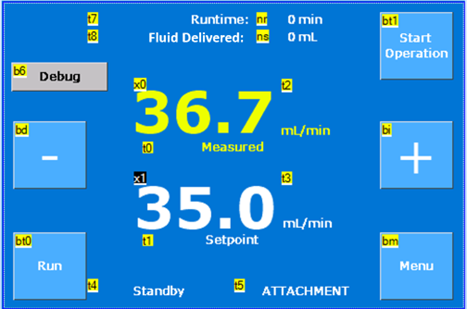
This GUI component will communicate with the ESP32 to send the input given by the user. The user will be able to select an attachment mode which will adjust the pump to the parameters necessary for the flow rate displayed on the screen and produced by the pump to be in sync with one another. The main page of the GUI will include the run/stop and increase/decrease setpoint flow rate buttons. It will also include the read time sensor reading update alone with the metrics counted. Another feature that has been added to the GUI is a keyboard that is displayed on the screen when the user wants to change the flow rate to a specific number.
The electrical team has also worked to troubleshoot the flowrate sensor to produce clear digital waves. Beforehand, the direct measuring of the sensor resulted in analog waves and no signals were produced due to flow. Yiwei was able to have a meeting with Silver Instruments, the manufacturer of the product, through a phone meeting to discuss issues with the flowrate sensor. After this meeting, the team was able to have the sensor produce clear digital waves through the use of a resistor ladder to manually adjust the voltage level to 3.3V for the ESP32’s specifications. The sensor is now able to read precise pulse counts at 200 millisecond sampling frequency.
Heat Generation Testing
The mechanical team has conducted heat generation testing to see how effective the system is at cooling a target area during a drilling operation. The team tested the flow rates 0 ml/min, 15mL/min, 50 mL/min, and 80 mL/min over a course of 30 seconds. Temperature of the surface was taken every 10 seconds in degrees Celsius to keep track of any temperature changes throughout the test trials. It was determined that our system did a good job at keeping the heat of the surface from increasing too much during the drilling operation.
More 3D Printing!
Two more 3D prints are in the process of being made! The first 3D model is the holder for the remote control that will control the flow rate for the system. This remote is designed such that it can be attached to the tube attachments allowing the user to aim and control flow rate in the same hand. The control will specifically be able to turn on/off the flow of fluid as well as increase/decrease the flowrate. The second 3D model is representative of a testing space, where the team will be able to use different materials such as foam to serve as an interior. The team will use this model as a way to test the functionality of our attachments and system while in a more confined space. Multiple insertion holes were added to allow for different angles, and a point of drainage was added as well.
With time barreling toward the upcoming FDR presentation, the team was able to close much of the distance to the finish line this week. Upon receipt of a new stepper peristaltic pump, the electrical sub-team rushed to integrate it into the team’s project. They successfully did so, calming worries about not having a powerful enough motor for the system to work. On another great note, the team’s second iteration of resin 3D printed sleeves was even better than that of last week. Sadly, the team’s Raspberry Pi gave out, so a replacement will need to be purchased.
Stepper Motor Pump
The electrical sub-team has programed a new peristaltic pump, which can reach even higher flow rates than the previous two pumps. Due to the motor in the pump being a stepper motor, as opposed to a DC motor, the electrical sub-team was able to wire it perfectly to fit within our electrical system. The untimely death of our Raspberry Pi means that our electrical system will have to wait until at least next week to be complete, however.
Stepper motor in motion
Flow Rate Remote
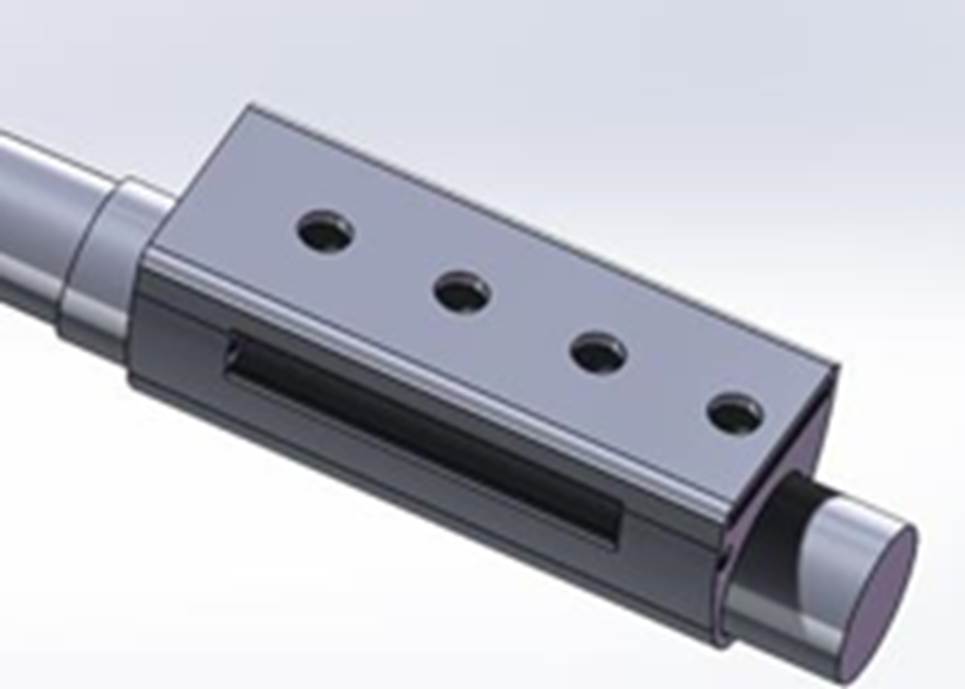
As far as the flow rate remote goes, the team has created a new attachment that allows the remote to fit onto a cylindrical shaft. Smaller pieces of the cylindrical attachment were sent to print to test sizing onto a pre-existing shaft that the team uses. If the fit is perfect, the team will print the full remote-shaft attachment.
Flow rate remote on cylindrical shaft
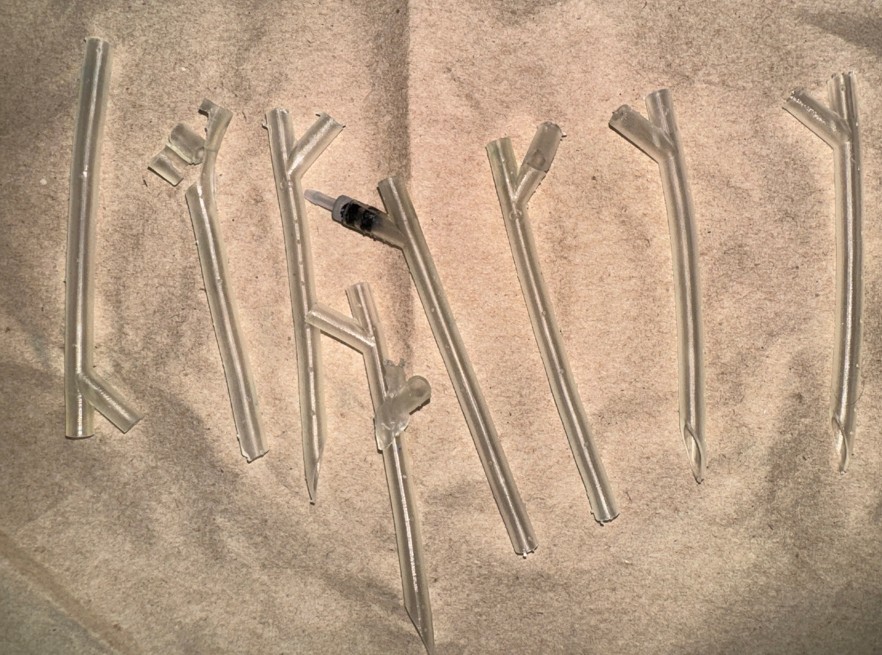
Tube Attachment Prints
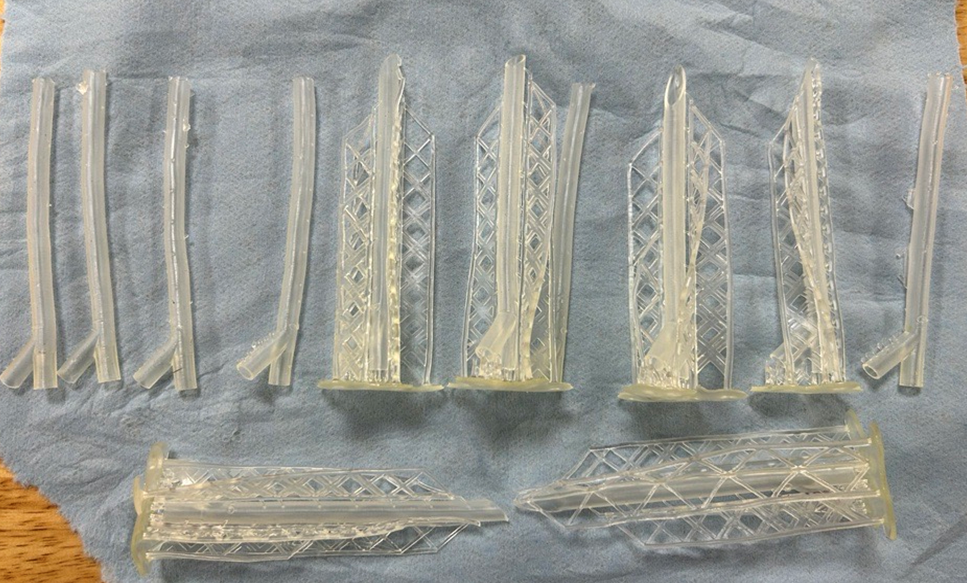
The team received eight new resin printed sleeves from David Sante. Testing the flow of water through the sleeve as well as the amount of coverage at the tip of the sleeve when placed onto a mandrel allowed the team to make some decisions about next steps. Initially, a tendency for resin material adhesion to the tool threatened to disrupt flow coverage. However, by moving the sleeve side to side, the team decoupled the material, revealing the true champions: sleeves of medium thickness without a 20-degree exit. These sleeves allowed for seamless sleeve installation onto a mandrel within a one-minute timeframe, while simultaneously minimizing backflow to a drop. Based on these findings, the team determined that subsequent iterations should incorporate an extended length, ensuring complete mandrel coverage from the handle’s distal end to the bending point. This modification aims to optimize performance and address the observed sleeve installation time and flow coverage challenges.
Changes are on the rise for the team after experiments with the peristaltic pump showed unfavorable results. The team’s next challenge will be to race against time to introduce a new peristaltic pump to the system in time for FDR in April. The mechanical prototyping however, is providing favorable outcomes for the housing and tube attachments.
DC Motor Pump
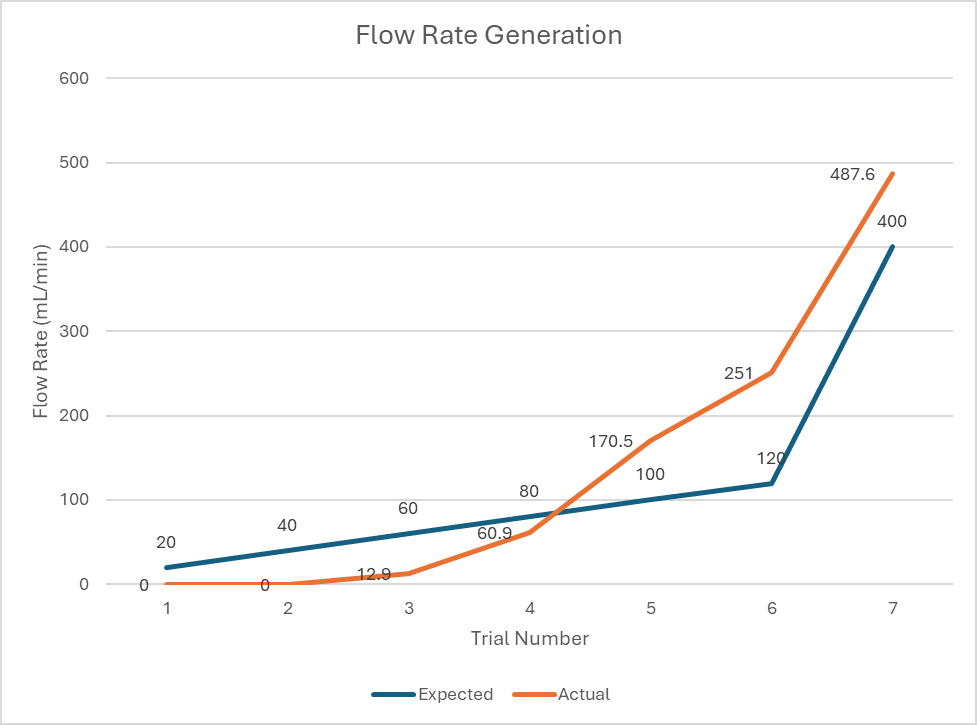
The electrical team has integrated the new peristaltic pump as well as tested flow rate generation testing. However, the results of the rudimentary testing proved that the pump is unable to run flow rates below 40 mL/min. A plot of the experimental data in comparison to the expected results are shown below. The expected flow rate was calculated through multiplying the maximum flow rate by the power going into the pump as this is how the current program determines and controls the flow rate that is produced by the pump. The resulting data produces a non-linear increase in flowrate when the expected outcome would be a linear increase in flowrate. The electrical team has decided that a new peristaltic pump that utilizes a stepper motor rather than a DC motor would be the best option to fix this issue. The team is currently in the process of purchasing a stepper motor pump so that we can begin integrating it with our own system by next week.
Rudimentary testing of new peristaltic pump
Housing Update
The mechanical team has printed a third iteration of the housing for the system’s electrical components. From the sizing tests last week, the team was able to add in the proper sized supports for the electrical components to be fixed along the walls of the device. This would ensure that even if the housing is being transported or shifted from its original position, all the components would stay in place. The new housing also ensures that the electrical components that are on the outer walls of the housing are all flat against the wall to improve the aesthetic and reduce the risk of anyone bumping any of the electrical components off the housing.
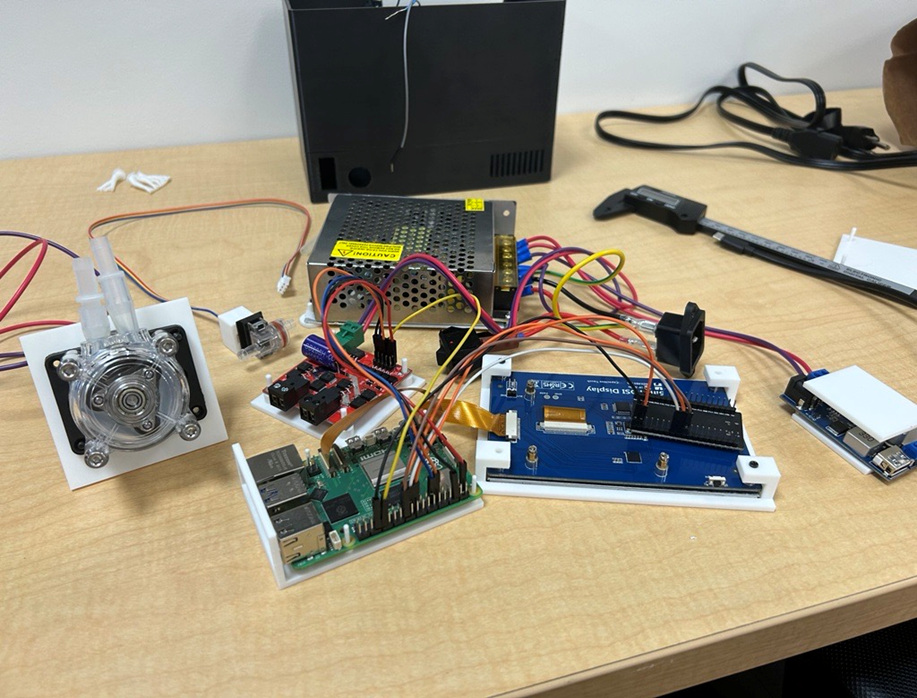
Housing with electrical parts secured
Inside the housing with electrical components fixed onto supports
Tube Attachment Prints
12 tube attachments have been printed by the Chemical Engineering Lab run by David Sante! These tube attachments are all clear and flexible allowing users to easily slide the tube attachments onto a mandrel and be able to visualize the flow within the attachments. These will be tested this week for fluid coverage of the tip of a mandrel at different angles. After testing, the team will analyze the results to determine the features of each iteration that worked the best such as inner diameter and shaping of the tip. These features will be used to remodel the next version of the tube attachment that will be printed at the beginning of next week.
The team is continuing to make improvements to the overall system. The sensor testing has continued with improved readings made possible by the electrical team. More 3D printing updates are on the way as well as the mechanical team has been improving the housing and working on flexible tube attachments.
Sensor Reading Testing
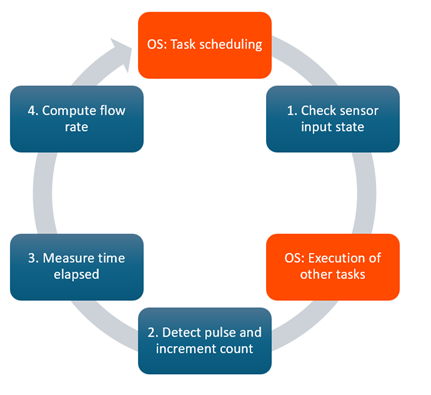
The electrical team has improved the Hall pulse sensor reading through the use of an ESP32, which is used as a dedicated microcontroller. Through incorporating ESP32, a new sensor reading system was devised to address inaccuracies in sensor reading.The electrical team has hypothesized that the primary reason for the inaccuracy from the sensor testing last week is the latency introduced by a non-real-time OS. Since the Raspberry Pi runs a traditional OS, its hardware communication relies on scheduled task execution, which may result in missed pulse readings and, consequently, lower measured flow rate.As illustrated in the diagram below, the OS schedules multiple tasks, including sensor input checks. However, because task execution follows a predefined queue rather than a real-time interrupt system, there can be a significant delay between the initial sensor state check and the actual pulse detection. This delay affects pulse counting, time elapsed measurement, and subsequent flow rate computation.
Sensor reading process using a hardware with a traditional operating system (RPi with Linux)
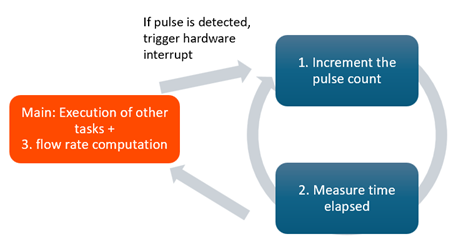
In contrast, the ESP32 offers real-time capabilities with its dedicated hardware timers and interrupt-driven processing. It can handle high-frequency pulses more reliably by triggering hardware interrupts whenever a pulse is detected, regardless of the execution state of other tasks. As shown in the diagram below, the ESP32 immediately interrupts ongoing tasks to process the sensor reading, incrementing the pulse count and measuring elapsed time with minimal latency.
Sensor reading process using a dedicated microcontroller (ESP32)
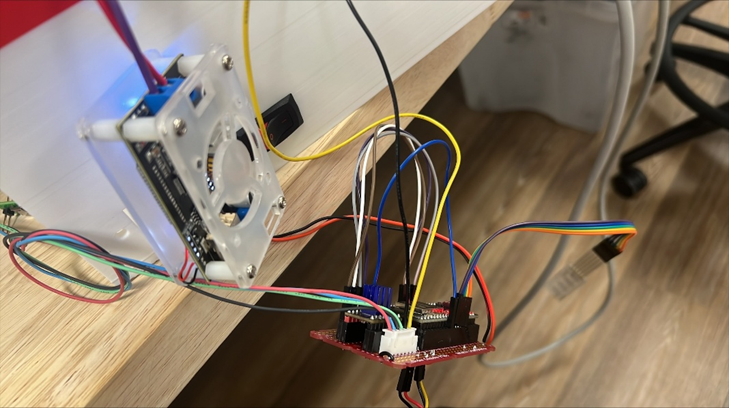
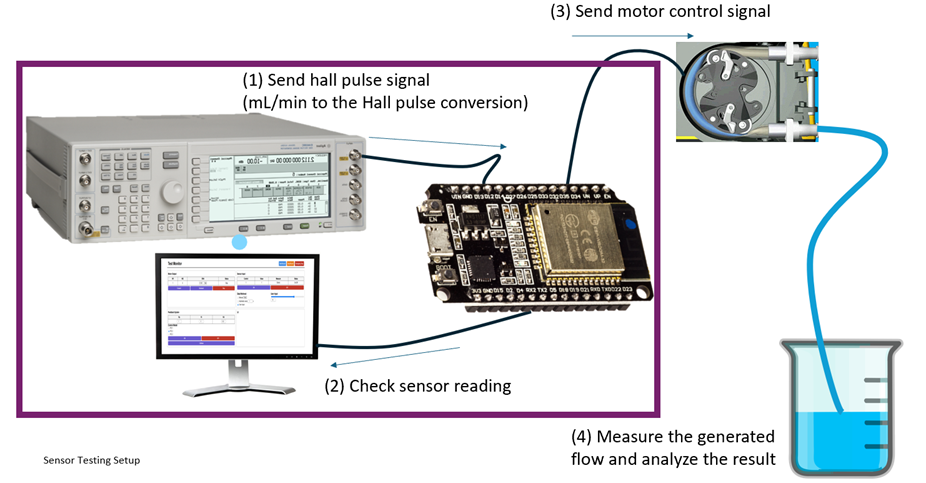
The testing for the new sensor reading system was conducted using the same method and setup as before, except the Raspberry Pi is replaced with the ESP32, as shown below.
Sensor Reading Test Setup
Housing Update
The mechanical team has been sizing all the components that will be fixed within the housing. The different sizing is to ensure that all the screw holes placed within the CAD model will match to the intended components. An updated model will be printed in the next week that will include access to USB ports for connection to a keyboard and mouse.
Different sizing templates for all components
Tube attachment prints
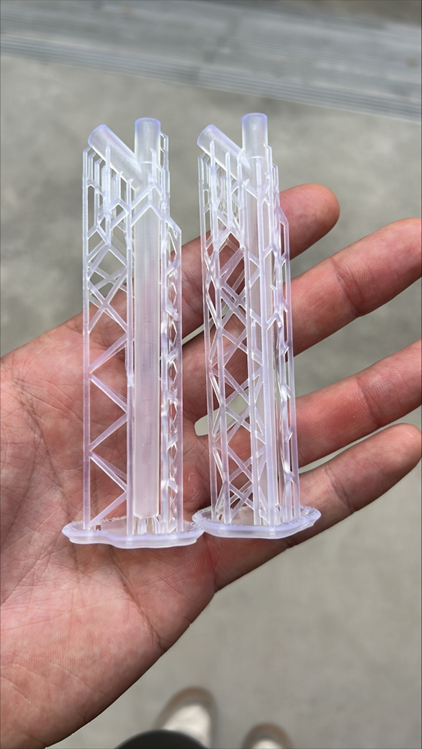
The tube attachments are now being printed using resin printers within the chemical engineering department! The resin printers will give the models a smoother finish and allow the lumen to be a much smaller size than the FDM printing allowed the team. To test how much the prints shrink after they finish printing, the team printed 2 test tube attachments with the clear, hard resin available. The team will measure the difference in size and adjust the design for future print iterations.
Tube attachment prints fresh off the printer with supports