This week was all about testing and acquiring quantitative data to prove our project meets the specifications of the scope of work and can function properly. This data is also essential for us to see if our current model requires any modifications or debugging.
The mechanical team was able to test if the capillary tubing would produce a flow rate close to the flow rate shown on the LCD screen of the control system. After testing, it was proven that both the change in tube sizing and the small size of the capillary tubing prevented the flow rate of the system to go above 30 mL/min even if the control system was set at a higher flow rate.
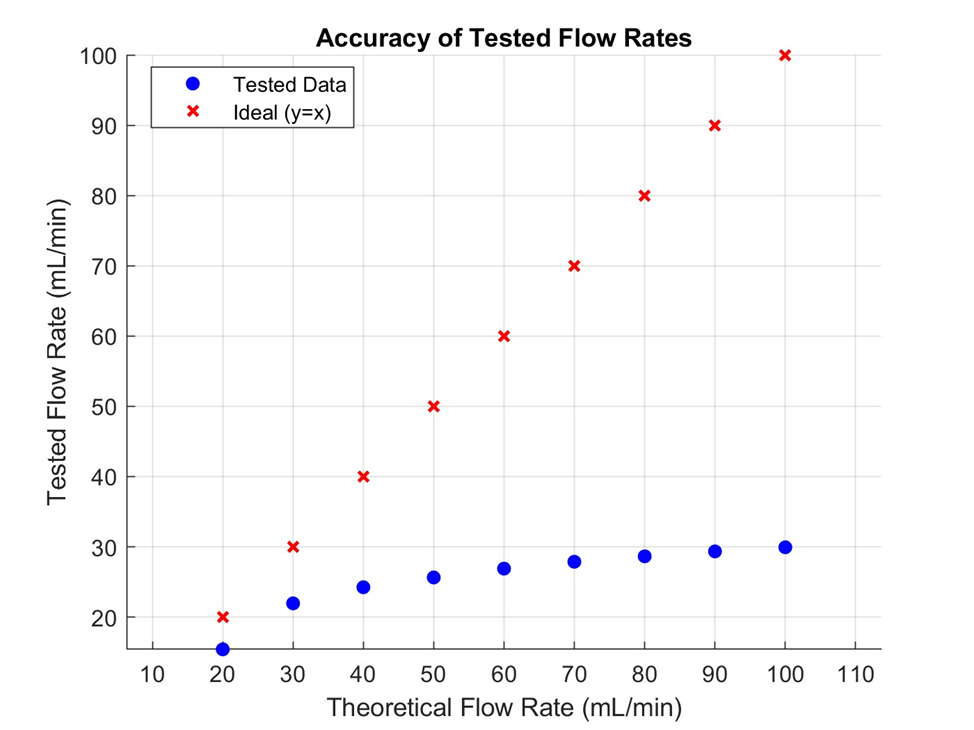
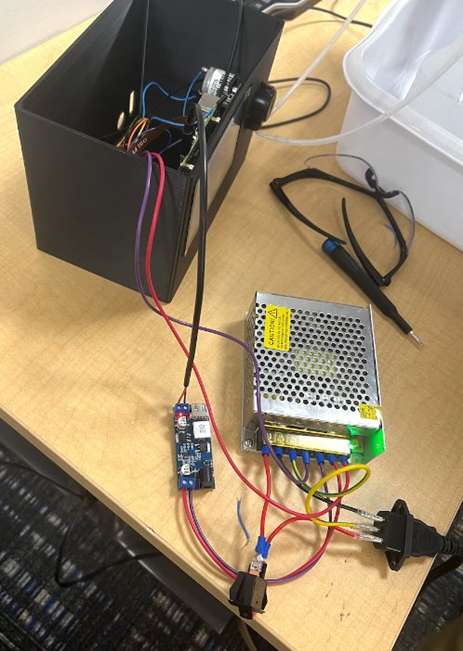
The electrical team has completed the assembly of the power system, enabling a single power source to supply the entire system, including peripherals. Additionally, they have conducted flow generation accuracy and precision testing jointly with the mechanical team. Data analysis confirmed the precision of the flow generation, but accuracy requires improvement. This would be achieved through applying control algorithms and fine-tuning the parameters . Lastly, the team has enhanced the testing software to have manual control features, allowing the whole team to test the system directly.