Blog Posts

Week 5: Getting Physical

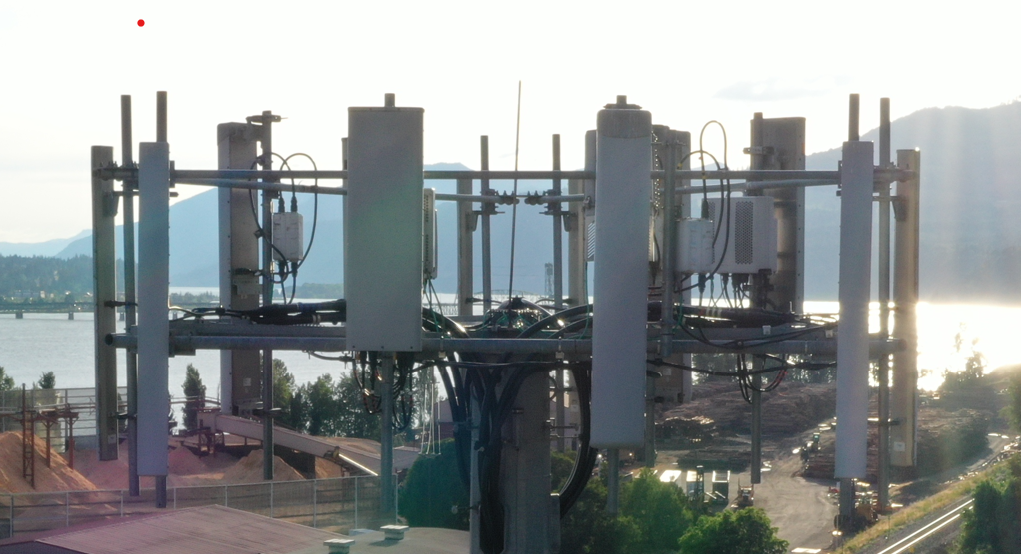
An additional part of our project is a hardware component, running our object detection model on a Jetson Nano in real time so that the drone operators can tell if the video they’re collecting is working well with the model, or if they need to adjust the camera settings. This week, we’ve gotten the hardware set up and have begun testing how to run our software on the relevant hardware.

Image of hardware components including the Jetson Nano, portable monitor, webcam, and bluetooth keyboard.

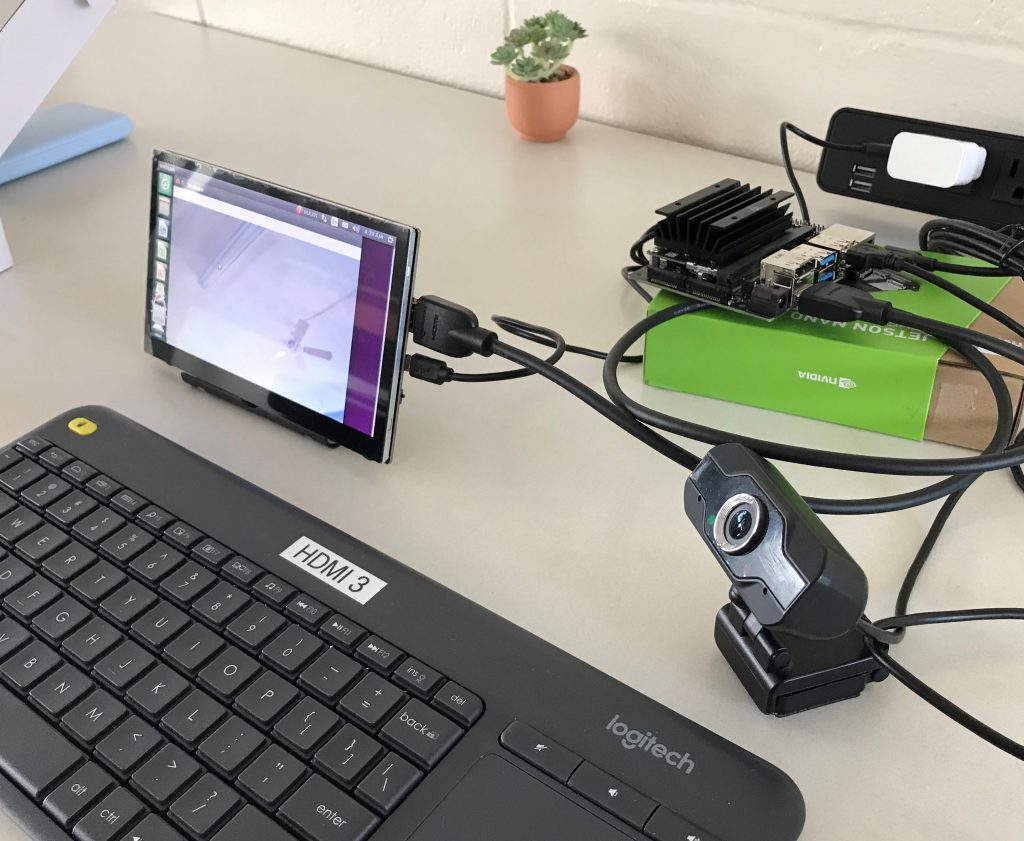
One of the first issues we encountered was power constraints. With the lower level hardware, it often wasn’t able to both power the various peripherals and run complex computations. This was addressed by simply using a Bluetooth keyboard (which has its own battery) saving it enough power to operate normally. The final product will not need to have these peripherals anyway, as the relevant programs will already be loaded onto the device and will only need to run.

With the power concerns addressed, we were able to run a basic face detection algorithm:

Output of Jetson Nano running YOLOv8 Face Detection

As you can see, the video runs quite slowly at the moment due to the processing required to run the machine learning model. To address this, we have a few options including finding ways to simplify the model, or exporting the model to another machine learning framework designed to run on lower level hardware such as TensorFlow Lite.

Week 4: Tracking the Path Forward

This week, we made significant progress in our object detection and object tracking algorithms

On object detection, with a batch of annotations on a new tower completed, we were able to run our algorithm on a new tower with different conditions from the initial video. Not only are there more antennas on this tower, but the camera setters were different, resulting in the overall video being brighter than the previous one. Adding this to our training data should allow our model to function in a wider range of conditions.

We also tested with two separate types of model: One to detect any antennas, and another to differentiate antennas viewed from the front from antennas viewed from the side.


Results of the two object detection algorithms.

The object detection algorithms had good results, with intersection over union values of over 90% for both models, and over 99% for the model to detect any antennas.

We’ve also made headway in the object tracking algorithm. In order to keep track of which data is associated with which antenna, we need to track the bounding boxes across the image.

Clip from results of object tracking algorithm

As you can see, the algorithm does a pretty good job at tracking the antennas, but runs into some issues towards the edges with regards to assigning the IDs. It seems that as an antenna rotates and approaches the point where the model should not register it, it switches back and forth between labeling it. This then causes the object tracking algorithm to assign a new ID.

Although this behavior can be reduced by improving the object detection model, to guarantee consistent behavior, we will want to add some post processing that will interpret the raw IDs outputted by the algorithm, and map them to the actual antennas, but for now, the fact that the algorithm is doing as well as it is is promising.

Week 3: Finding Where We Are

This week, we continued our work on the angle calculations, along with improving our object detection algorithm and making progress on the 3D tagging.

In the angle calculation algorithm, the next step after finding and matching key points is to use those keypoints in calibration and triangulation. The goal of calibration is to determine where in 3D space the image was taken from in each picture, then using triangulation to determine where in 3D space each point would need to be in order for them to be at those locations in each image.

When a given point appears in two different locations in two images taken from different perspective, there is one spot in 3D space that point can be. If you know the location the images were taken, you can calculate it.

Traditionally, the location of the camera in both perspectives are calculated using the points themselves. Based on how much the matched points move between the perspectives, you can infer how the camera moved. But these calculations may not be necessary. Because the drone collects metadata on the position and orientation with GPS and gyroscopes, we may be able to use that data directly to determine the positions.

Plot in 3D space of drone position according to metadata
Plot in 2D space of drone GPS coordinates

The primary concern with using this data is the potential for inaccuracy. As you can see in the images, the points tend to align along certain lines unnaturally. This indicates that the values stored in the metadata are rounded, introducing some amount of error. We won’t know how much this error will affect things until we get some initial results, however we will have potential areas to address if those results need improvement.

Week 2: A Matter of Perspective

This week, we’ve made pretty significant progress on our angle calculation algorithm. This algorithm relies on a process called Structure from Motion (SfM). SfM relies on two separate perspectives of the same object, and by extracting key points of the object that are recognizably the same in both images, it can calculate where those points are in 3D space.

The first step in this process is finding and matching those key points, something we’ve been able to do as shown here:

Images that we are running our keypoint analysis on
Images overlaid with matched keypoints after running algorithm

Our algorithm has been able to find and match many points across the image, however you may notice there aren’t many on the antennas themselves. While the other points will still be useful in the calculations to calibrate the camera properties and positions, one of the things we will need to do is ensure that we have enough information about the antennas themselves to reliably find their orientation. We have a few ideas for how to accomplish that, so stay tuned to see how those ideas perform.

Week 1: New Semester, Same Vizion

The team after our first coach meeting of the semester, where we plotted the path forward.

With the break to reflect on the first semester, deciding what went well and what could be improved, we’re ready to start the spring semester off strong with roles defined and members prepared to begin work on our different components of the system.

In addition to improving upon our existing object detection model, we have also begun making the preparations for our angle calculation functionality, and plans for the 3D tagging algorithm. With much of the research done, we’re ready to jump into the coding and getting some initial results.

Finally, we’ve also streamlined our process for task assignment and accountability to keep things organized and ensure everyone knows what they need to work on each week. We are optimistic about the new system and hoping it will help us get results sooner, so that we can iterate and improve faster.

Week 16: System Level Design Review

This week we finally presented our System Level Design to a wide audience of IPPD sponsors and teams.

Their feedback was great. They provided insight on our object detection and angle calculation algorithms.

It was also great to see all the other projects.

This ends our progress for this semester. We’re excited to start fast development next semester!

Week 12: More Data! WOO!

This week we received two more videos of cell towers. Even better, they have meta data such as GPS and accelerometor informatics.
The metadata will be great in our antenna angle calculations. It may simplify the problem much further than we originally planned. This data gave us a different persepective and allowed us to make a lot more progress in our system level design.

Week 11: The Start of SLDR

The System Level Design Review is a few weeks from now.

We’re beginning to prepare the report. As we begin to develop our software architecture at a system level we are brainstorming a lot of concepts for the antenna angle calculations.
We’re starting to focus our research a lot more on this. We’ve found popular methodologies used to solve similar problems and have discussed how they may adapt to our project with our coach.

We’re excited to see how our ideas come together.

Week 10: Prototype Inspection Day

This week we presented our progress on our prototypes.

At this point we had finished developing our object detection model from the first set of data we received. Our object detection would work fairly accurately but needed more data.

Additionally, we presented the framework for our user interface. At this point it had the functionality of creating inspection records and allowing the user to upload a video. This was important at this point in order to start connecting our back-end scripts to the UI as soon as we have them available.

Week 8: Emergence of the vizion

Our final project consists of two software modules, one for object detection and another for angle calculations. In our PDR and prototype presentations, we have demonstrated our progress in building the object detection model and discussed our approach in designing the angle calculation algorithm.

Our object detection model now is able to detect antennas in an input image and outputs the coordinates. The computer vision team in Verizon were happy to see the result and wanted to discuss further about the relevant project they are working on that may complement our project. In the prototype presentation, we have received valuable feedbacks from the judges.

Based on the feedbacks and our current progress, we have divided our team into two groups, one to work on object detection and another to work on angle calculation. Our object detection team now is focusing on creating an end to end pipeline that can train the model any time new we have new data available. Additionally, we want to the results to be reproducible and develop a robust performance metrics to evaluate accuracy. Our goal is to automate the entire process of feeding the data, training, making predictions, and evaluating performance.

These are some of the results of our model on the test data.

Figure 1: Object detection model performance that detects antennas with front views.

Figure 2: Object detection model performance that detects antennas with front and side views.